Close Menu
  • Home
  • Crypto News
  • Tech News
  • Gadgets
  • NFT’s
  • Luxury Goods
  • Gold News
  • Cat Videos
What's Hot

Garmin CIRQA Review: Fitness Tracking Without Screens

August 25, 2026

ASMR Making Slow-Feeder Cat Food 🐱💖#animalshorts #cat #cats #catvideos #catshorts #pets #asmr #fyp

August 25, 2026

ASUS’ First Gaming Soundbar Is Now Available In The US For $600

August 25, 2026
Facebook X (Twitter) Instagram
  • Contact Us
  • Disclaimer
  • Privacy Policy
  • Terms of Use
  • DMCA
Facebook X (Twitter) Instagram
KittyBNK
  • Home
  • Crypto News
  • Tech News
  • Gadgets
  • NFT’s
  • Luxury Goods
  • Gold News
  • Cat Videos
KittyBNK
Home » FET Price Jumps 69% To 200D EMA; Will Bulls Reclaim $2? 
Crypto News

FET Price Jumps 69% To 200D EMA; Will Bulls Reclaim $2? 

August 27, 2024No Comments2 Mins Read
Facebook Twitter Pinterest LinkedIn Tumblr Email
FET Price Jumps 69% To 200D EMA; Will Bulls Reclaim ? 
Share
Facebook Twitter LinkedIn Pinterest Email

With a bullish recovery rally in motion, FET price action shows a streak of green candles finally taking a step back. The uptrend accounts for a 69% surge in the last eight days to reclaim the $1 psychological mark as the broader market recovers. 

As the uptrend takes a pause, will the sellers manage to regain trend control for a deeper pullback? Or is this the best opportunity to buy the FET token at this small dip?

FET Price Performance 

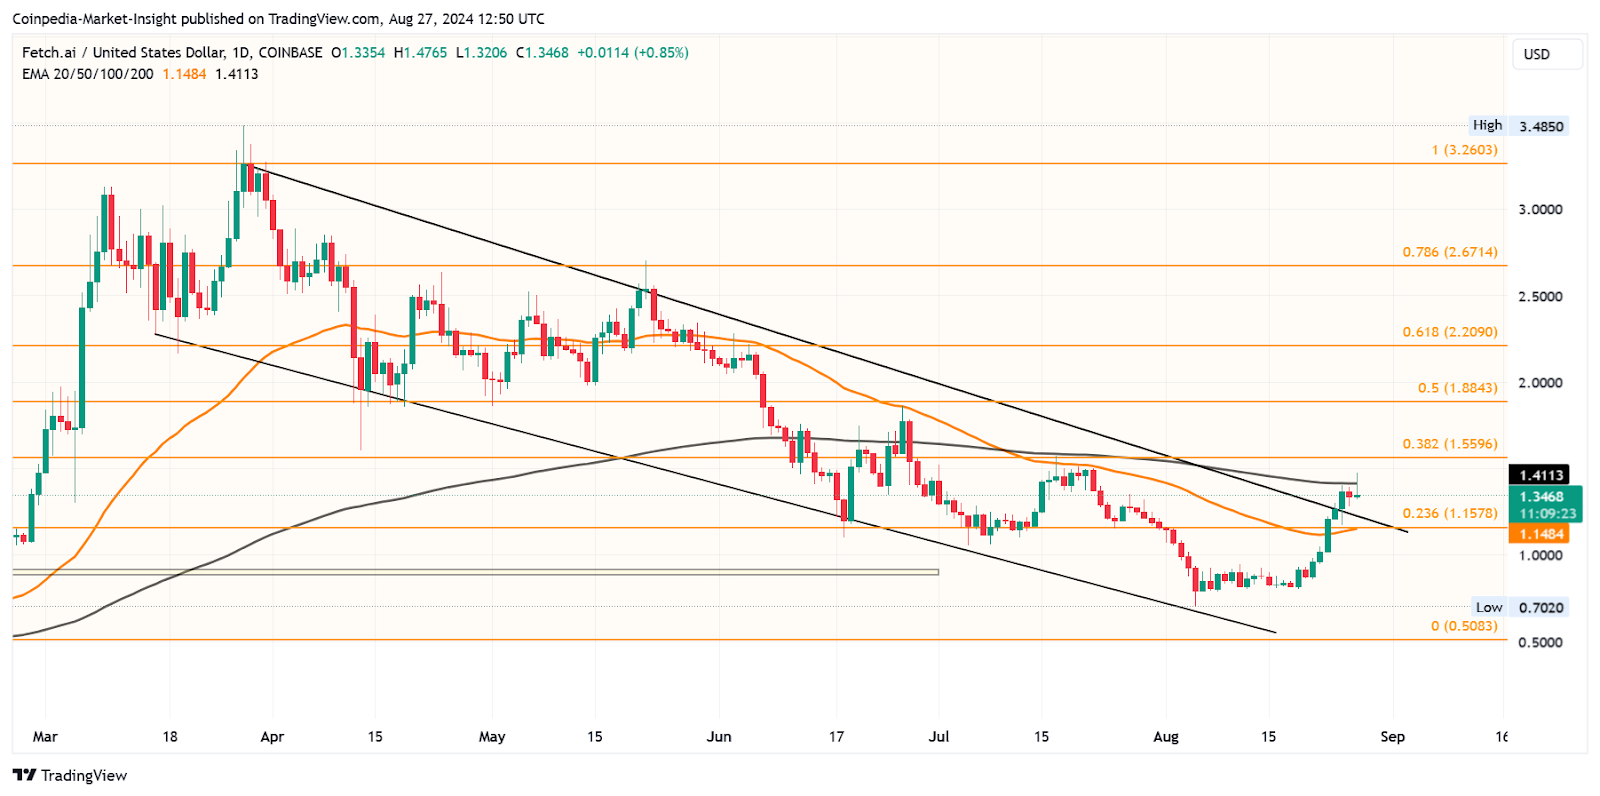
With a bearish trend in the 1-day chart, the FET price action reveals a falling channel pattern. Furthermore, the increased bearish influence results in a death cross between the 50D and 200D EMA. 
FET Price Jumps 69% To 200D EMA; Will Bulls Reclaim ? 

However, the recent bullish reversal from the $0.70 support level and the declining trendline puts the buyers back in action. The reversal rally breaks above the pattern and surpasses the 50D EMA. 

However, the sudden surge in supply results in a minor intraday pullback. This results in the failure of the uptrend, surpassing the 200D EMA and the 38.20% Fibonacci level at $1.55.

Technical indicators:

EMA: The declining 50D EMA finds an uptick with the recent reversal in the FET prices. Thus, the chances of a bullish crossover to regain the positive alignment have increased. However, the failure to surpass the 200D EMA puts the uptrend at risk. 

Will FET Price Hit $2?

With the channel breakout, the minor intraday pullback increases the chances of a retest of the broken trendline. However, an early reversal from the 50D EMA could reinstate the uptrend in motion. 

Based on the Fibonacci levels, the uptrend sustaining above the 23.60% Fibonacci level could surpass the $1.55 mark in a post-retest jump. The breakout rally can find resistance at the 50% and 61.80% Fibonacci levels at $1.883 and $2.20, respectively. 

On the flip side, the $1 psychological mark and the $0.70 mark remain crucial support levels. 

Credit: Source link

Share. Facebook Twitter Pinterest LinkedIn Tumblr Email

Related Posts

Bitcoin Price Prediction: BTC Clears $80K, Bulls Eye Next Target

August 25, 2026

Bitcoin, Ethereum and XRP Prices Hold Back as Scott Bessent Launches Operation Economic Outcast

August 24, 2026

BGB Price Faces Key Test as Bitget Launches $40K Campaign

August 24, 2026

Bitcoin Price Faces a Familiar Trap as Whales Start Selling

August 24, 2026
Add A Comment
Leave A Reply Cancel Reply

What's New Here!

Apple’s M2 Mac mini drops to a record low of $479

June 10, 2024

Luxury real estate presents vast opportunities

March 28, 2024

IsMyLova Is Revolutionizing Miami’s Luxury Fashion Scene

April 15, 2024

Marshall adds a subwoofer and compact soundbar to its Heston TV audio lineup

September 2, 2025

Gatto on Telegram: Earn TON Tokens While You Play

September 20, 2024
Facebook X (Twitter) Instagram Telegram
  • Contact Us
  • Disclaimer
  • Privacy Policy
  • Terms of Use
  • DMCA
© 2026 kittybnk.com - All Rights Reserved!

Type above and press Enter to search. Press Esc to cancel.