- The Pendle price challenges the bottom trendline of an inverted flag pattern for a potential breakdown.
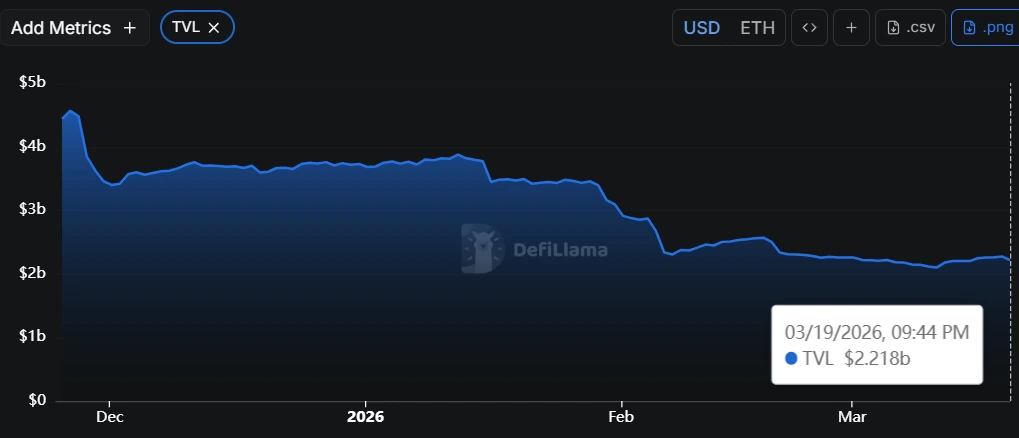
- A stagnant TVL at $2.25 signals reduced investor participation in the Pendle ecosystem.
- The open interest tied to Pendle futures contracts at $32 million showcases a lack of speculative force to support price recovery.
PENDLE, the native utility token of the Pendle finance protocol, slips 1.43% during Tuesday’s U.S. market hours to trade at $1.25. The downtick aligns with broader market pullback as the Federal Reserve decision to hold rate cut steady on Wednesday triggered a risk-off sentiment in the market. However, the Pendle price faces additional pressure as a sluggish trend in total volume locked and futures trading indicates limited capital flowing into the protocol.
Pendle Price Stalls as Weak Liquidity Signal Extended Consolidation
On March 19th, the crypto market extended its downtrend, which pulled its market cap to $2.41 trillion, registering 1.14% loss. The selling pressure came as a follow-up to yesterday’s sell-off, as a hawkish tone from the Fed suggested that liquidity-boosting rate cuts were still months away.
As a result, Bitcoin price lost $70,000 again while the Pendle price hit $1.24 and continued its ongoing consolidation.
Along with a sideways price action, the capital commitment to Pendle DeFi service also witnessed a sluggish trend. According to DefiLlama data, Pendle’s TVL has been wavering around $2.25 billion since early February. This indicates weak capital inflows and a lack of fresh liquidity entering the Pendle ecosystem, suggesting that investors are largely sitting on the sidelines rather than actively deploying funds.
The stagnant TVL reflects limited confidence or reduced demand for Pendle’s yield strategies, which in turn restrains any strong bullish momentum in price action.
In addition, the derivative trading also remained at a lower end with no significant spikes to support price action. Data from Coinglass shows that the open interest tied to Pendle has been wavering around $32.65 million. This failure to expand in open positions indicates low participation by leveraged traders and low speculative interest.
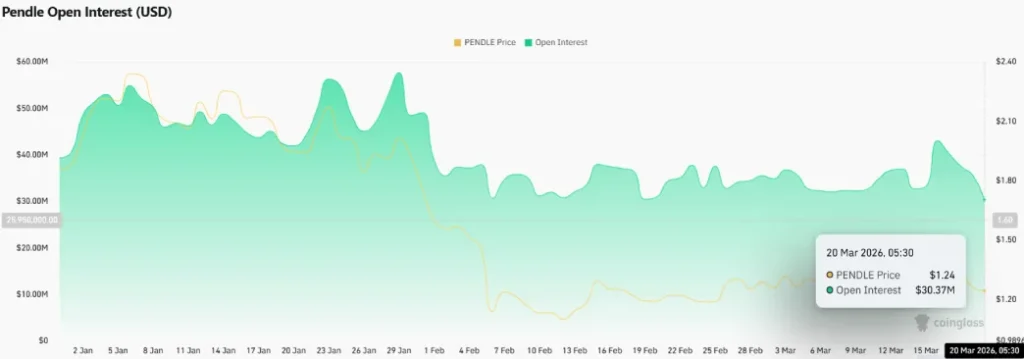
Altogether, the combination of stagnant TVL and flat open interest is indicative of a market with a lack of conviction where participants are not willing to make strong directional bets – ultimately reinforcing the ongoing phase of consolidation.
Pendle Price Poised For Major Breakdown From Flag Pattern
In the last three days, the Pendle price has plunged from $1.4 to $1.24 current trading value, accounting for a loss of 10.57%. This pullback indicated another failed attempt from the price to sustain above the $1.35 resistance, suggesting an active profit booking under pressure amid weak market sentiment.
Currently, the Pendle price seeks support at the bottom trendline of a classic bearish continuation pattern called an inverted flag. The chart setup is commonly spotted between an established downtrend, as it provides a temporary relief rally to recoup the bearish momentum.
Therefore, a bearish breakdown below the bottom trendline around $1.24 would further accelerate the selling pressure, proposing a drop of another 16% to test the psychological level of $1.
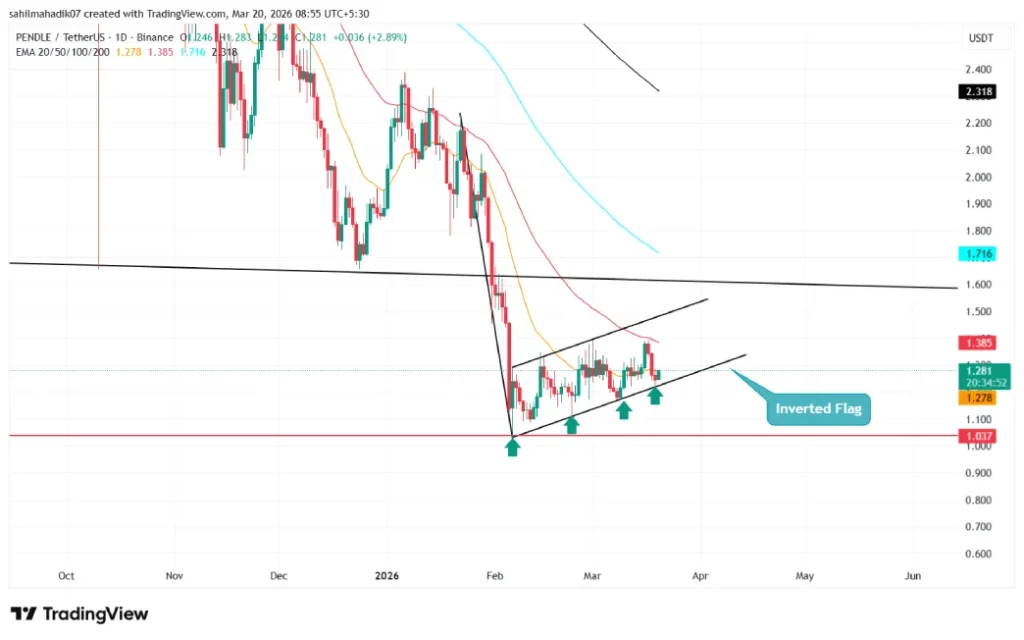
On the contrary, if coin prices manage to break the flag resistance around $1.6, the buyers could strengthen their grip over this asset again.
Credit: Source link