
- The Bitcoin price challenges the key resistance trendline of inverted flag pattern, signaling a potential breakout to kickstart fresh recovery.
- Easing geopolitical tensions acted as a catalyst for renewed risk-on sentiment across crypto markets.
- A potential bullish crossover between the 20-and-100-day exponential moving average could renew the buying pressure in BTC
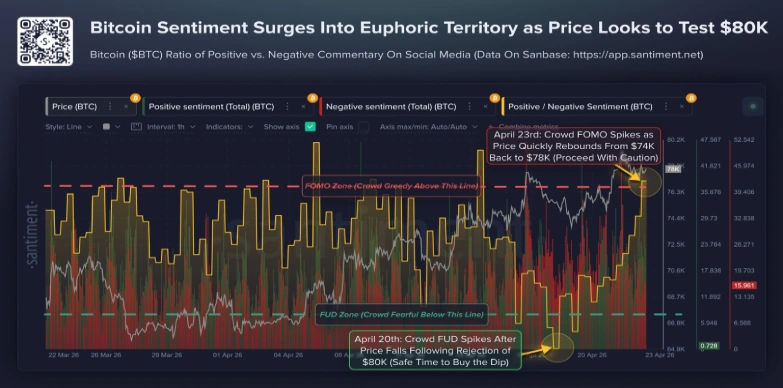
On Thursday, the Bitcoin price witnessed low volatility sideways trading around the $78,500 level. While a short-bodied candle may indicate initial uncertainty in the market, the long-tail attached to this base indicates intact demand pressure. Recent on-chain data shows market sentiment has shifted into high gear. FOMO (Fear of Missing Out) is officially back, with crowd support surging as investors prepare for the next major breakout.
BTC Swings From FUD to FOMO
In the last three weeks, the Bitcoin price bounced from $64,950 to $78,375 current trading value, registering a gain of 20%. Consequently, the asset’s market capitalization bounced to $1.56 trillion. A primary catalyst for this surge was de-escalation of geopolitical uncertainty, as the three nations U.S., Iran, and Israel agreed into a temporary ceasefire.
The Bitcoin market is currently experiencing a tumultuous environment, ruled by a mixture of geopolitical negotiations at a standstill and rapidly changing market sentiment. After a rejection at $80,000 earlier this week, price action slipped into a “Fear, Uncertainty, and Doubt” (FUD) stage. This cycle of bearish sentiment, marked by a price correction down to $74,000, has historically been a strategic buying opportunity followed by a swift recovery.
By Thursday, the narrative shifted entirely. The market rebounded towards $78,700 and a wave of FOMO among retail traders ensued. Although being close to the $80,000 resistance zone may be a harbinger of a significant push higher, the data shows that investor sentiment is reaching levels consistent with local tops.
Market forces often buck the trend; as such, market analysts are watching to see whether this wave of optimism will sustain or correct before embarking on a more concerted march into new highs.
Bitcoin Price Challenge Bear Flag Pattern For Bullish Breakout
By the press time, the Bitcoin price trades at $78,220, with an intraday gain 0.08%. Earlier today, the sellers attempted to redirect this asset to another correction, but the coin price showed notable resilience.
With a long-tail rejection tail in today’s candle, indicate intact demand pressure from Bitcoin BTC-0.29% above $77,000. If the bullish momentum persists, the buyers could challenge the overhead resistance of inverted flag patterns in daily charts.
Therefore, a potential breakout from this barrier will accelerate the buying pressure and bolster Bitcoin price to $83,960, followed by a leap to $90,500. The momentum indicator RSI bounced to 64% accentuates the returning bullish momentum in price.
The chart setup is characterized by an initial downtrend in price, followed by a temporary relief rally to regain bearish momentum.
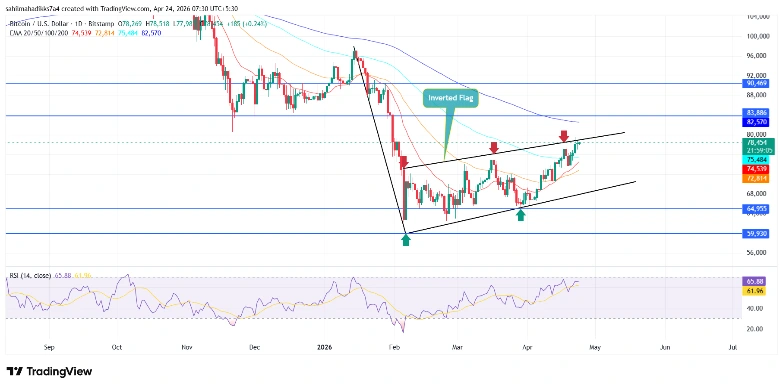
On the contrary, if the overhead resistance trendline remains intact, the Bitcoin price could plunge 10% down to $70,000 mark, before challenging the flag pattern support. A bearish breakdown below this floor will prolong the current correction to the $60,000 floor.
Credit: Source link