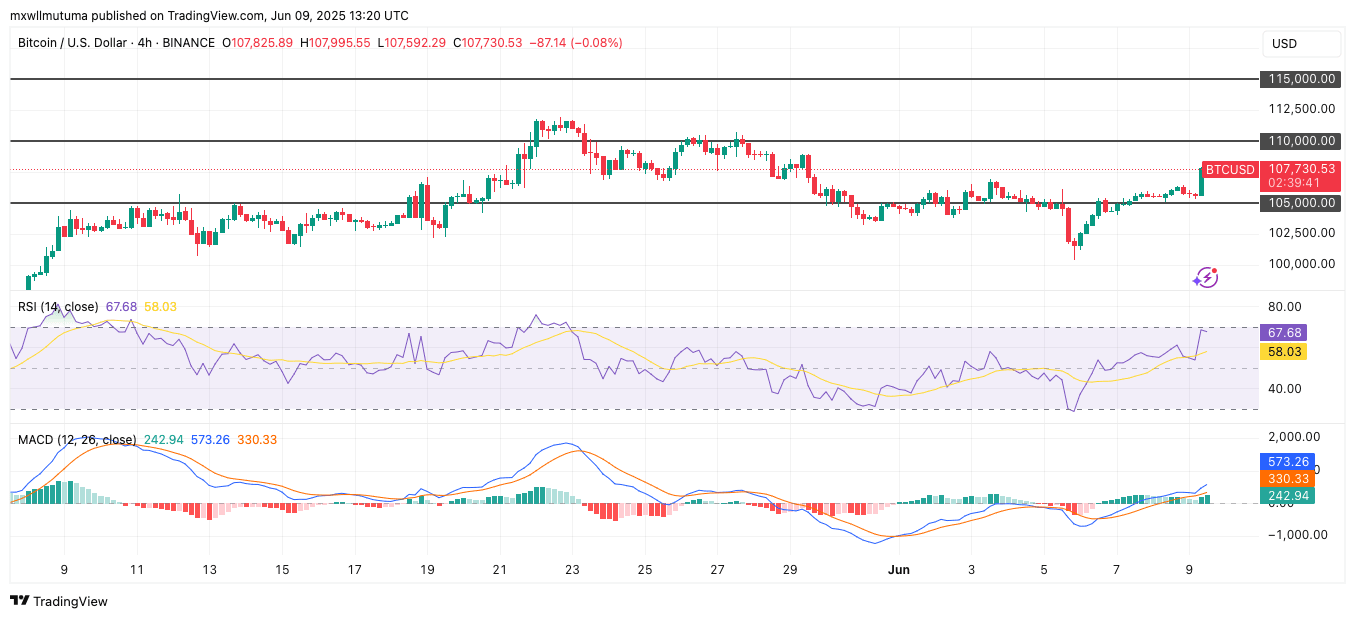
Bitcoin price has climbed sharply over the last 24 hours, continuing its upward momentum from a recent bullish trend. The asset is currently trading above $107,000 after forming strong support levels.
Major altcoins such as Ethereum, priced at $2,500 at the time of writing, are all showing a steady increase as well. XRP, Solana, and Dogecoin are making positive movements in the market today. The whole crypto market is witnessing this growth, as the total market capitalization went up to $3.34 trillion with an increase of 1.65% over the timeframe.
Bitcoin Price Resurges Above Head & Shoulders Neckline
Bitcoin price has bounced back above the pivotal Head & Shoulders neckline, shaking off what seemed like a breakdown. Initially, the price drop below the neckline triggered concerns among traders, but it now appears to have been a false alarm or a “trap.” With this recovery, Bitcoin is poised for more potential gains, showing signs of a fresh bullish phase.
The fact that prices have climbed over the key level has caused some traders to feel more positive and hopeful, waiting for Bitcoin to rise further. As as the price stays above the neckline, the bullish trend is still in place and more gains can be seen soon.
#Bitcoin Back on Track 🚀#BTC is now back above the Head & Shoulders neckline. What looked like a breakdown was just a trap.
More upside potential ahead! 🚀 pic.twitter.com/vexmyVeQCT
— Titan of Crypto (@Washigorira) June 9, 2025
Crypto Analyst Predicts Potential Breakout for BTC Price
Crypto analyst Captain Faibik highlights that the Bitcoin price is currently forming a descending broadening wedge on the 4-hour chart.
This technical pattern suggests increasing volatility as the price fluctuates within wider bounds. The key level to watch is the resistance at $105,700, as a break above this price would confirm a bullish breakout.
If Bitcoin manages to surpass this crucial resistance, the breakout could signal the start of a new all-time high (ATH) of $111,970. The potential for upward movement is significant, with analysts suggesting that this breakout could propel Bitcoin’s price towards higher levels.
$BTC is forming Descending Broadening Wedge on the 4H chart..
Bulls must break above 105.7k Resistance to confirm a Bullish breakout..
Breakout = New ATH loading soon 🚀#Crypto #Bitcoin #BTC #BTCUSDT pic.twitter.com/YB1xry0HGd
— Captain Faibik 🐺 (@CryptoFaibik) June 9, 2025
How High Can BTC Price Go In June 2025?
The price of Bitcoin has risen steadily, and as of now, it is trading at $107,747.03. As of June 9, 2025, BTC has increased by 2%, showing it is headed in an uptrend. There are positive technical indications, and the market has climbed over resistance points, giving it this momentum.
Bitcoin price has gone above the $105k level and could reach the strong resistance zone at $107,747. If the trend stays the same, the market can move to $110k, then $112,500, and finally break through $115k.

The Relative Strength Index (RSI) is currently at 67, indicating the market is nearing overbought conditions. The MACD indicator indicates that there is a strong uptrend going on. The histogram is still going up, so we can expect positive movement in the foreseeable future. If Bitcoin goes below $100k, traders should be prepared for a short-term sliding trend.
Credit: Source link