The bearish cloud is growing darker over the crypto and global markets due to the ongoing conflict in East Asia. With the tension rising in the global markets, the crypto industry has lost 15% of its total valuation in three weeks and stands at $2.224 Trillion, crashing Bitcoin under $63,000.
Amidst such a sell-off, the net inflow of the Bitcoin ETFs has been negative for two consecutive trading days. Only Grayscale Bitcoin Trust and BlackRock’s $IBIT had outflow/inflow today, while the rest had zero net flows for the second trading day.
Under such conditions, will Bitcoin Halving manage to revive the rally in BTC prices? Will the BTC price prediction of $100,000 hold true? Will Bitcoin Cash amplify the Bitcoin jump to bolster the BCH price prediction of a run to $1,000?
Let’s have a closer look at their price analysis to find out.
Will Bitcoin Survive Above $60,000?
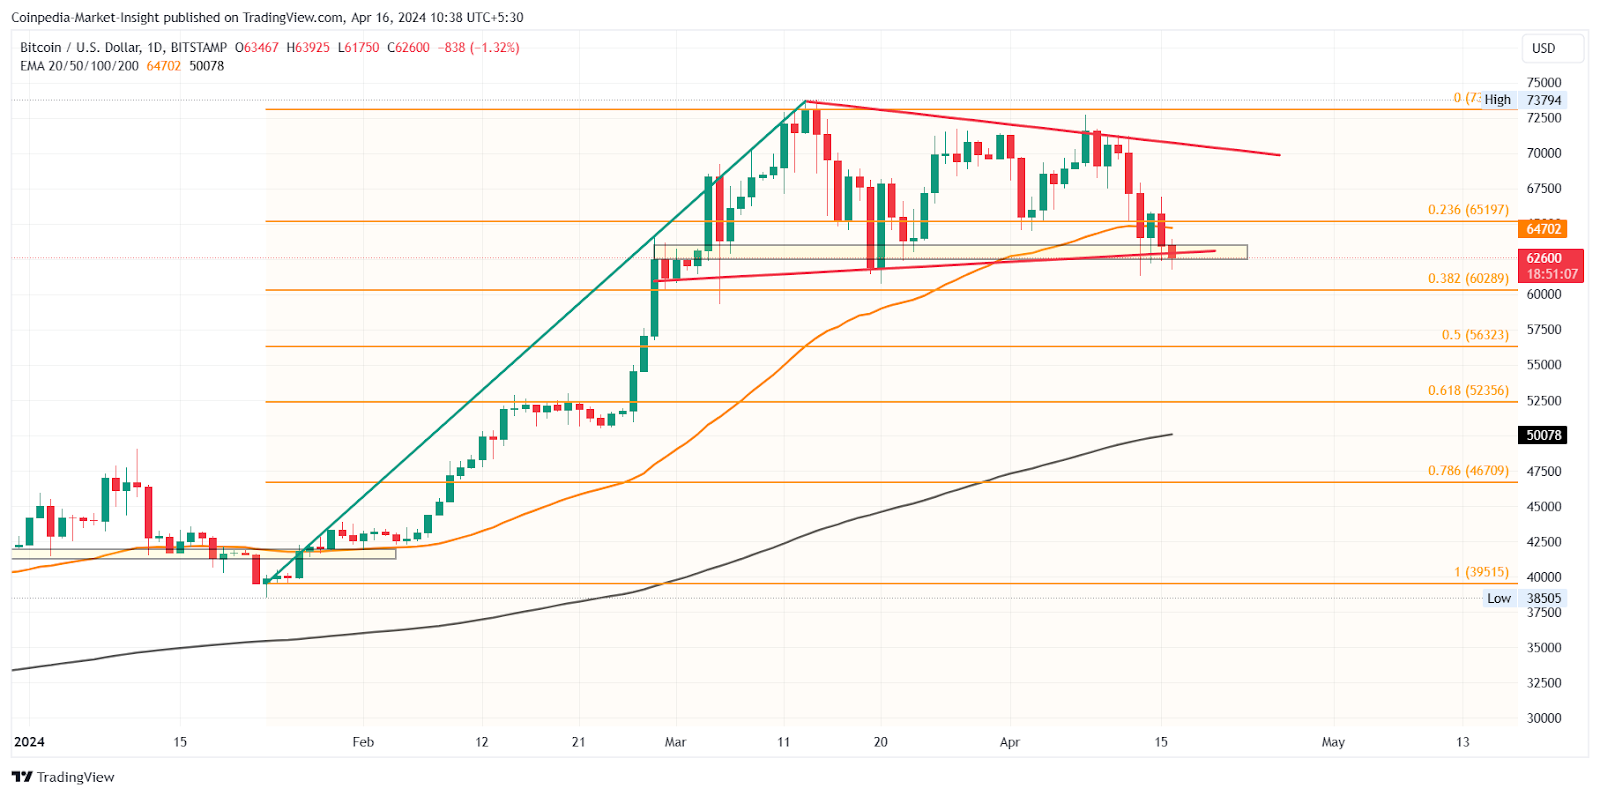
With Bitcoin price crashing back to the $62,000 level, the underlying support trendline is under extreme selling pressure. Further, the demand zone at the $62,000 struggles to provide any cushion for a reversal in BTC prices.
TradingView
As the selling pressure grows, the buyers are failing to hold the bullish flag pattern in the daily chart. The sideways trend taking a bearish reversal warns of a drop below $60,000. This questions the possibility of a bull run to $100,000.
As the bearish sentiments due to the Iran-Israel conflict undermine the Bitcoin Halving hopium, the reversal chances are at a minimum.
As the supply grows, the threat of downfall is imminent and could plunge the BTC price to under $60,000. The support levels per the Fibonacci retracement are at $60,000 and $56,000.
On an optimistic note, if the Bitcoin Halving revives the lost drive, the BTC price could hike to $70,000 to challenge the resistance trendline.
Read More : With BTC Price Stuck Around $65,000: Here is the Bullish Perspective for Bitcoin in the Long Term
Will BCH Price Avoid A Drop To $400?
Being closely related to Bitcoin has its ups and downs for Bitcoin Cash. Currently, the BCH price faces a strong supply force due to the crash in the BTC prices. The downfall has erased 30% of the Bitcoin Cash market cap and warns of an even more intense crash.

TradingView
The pullback comes after a bull run of 150% in March and forms an evening star pattern in the weekly chart. Further, the BCH price loses the psychological mark of $500 and heads to the 23.60% Fibonacci level at $410.
With the bears in control, the golden crossover in the weekly chart is under question. Hence, the downfall projects a potential drop to the $400 mark in Bitcoin Cash.
Also Check Out : Bitcoin Losing Crucial Support: Here is What One Can Expect from the BTC Price Rally
However, in case the BTC buyers revive the bull run, the BCH trend will project an amplified sprint in recovery. While doing so, the next resistances for Bitcoin Cash are at $605 and $762, per Fibonacci retracement.
Credit: Source link