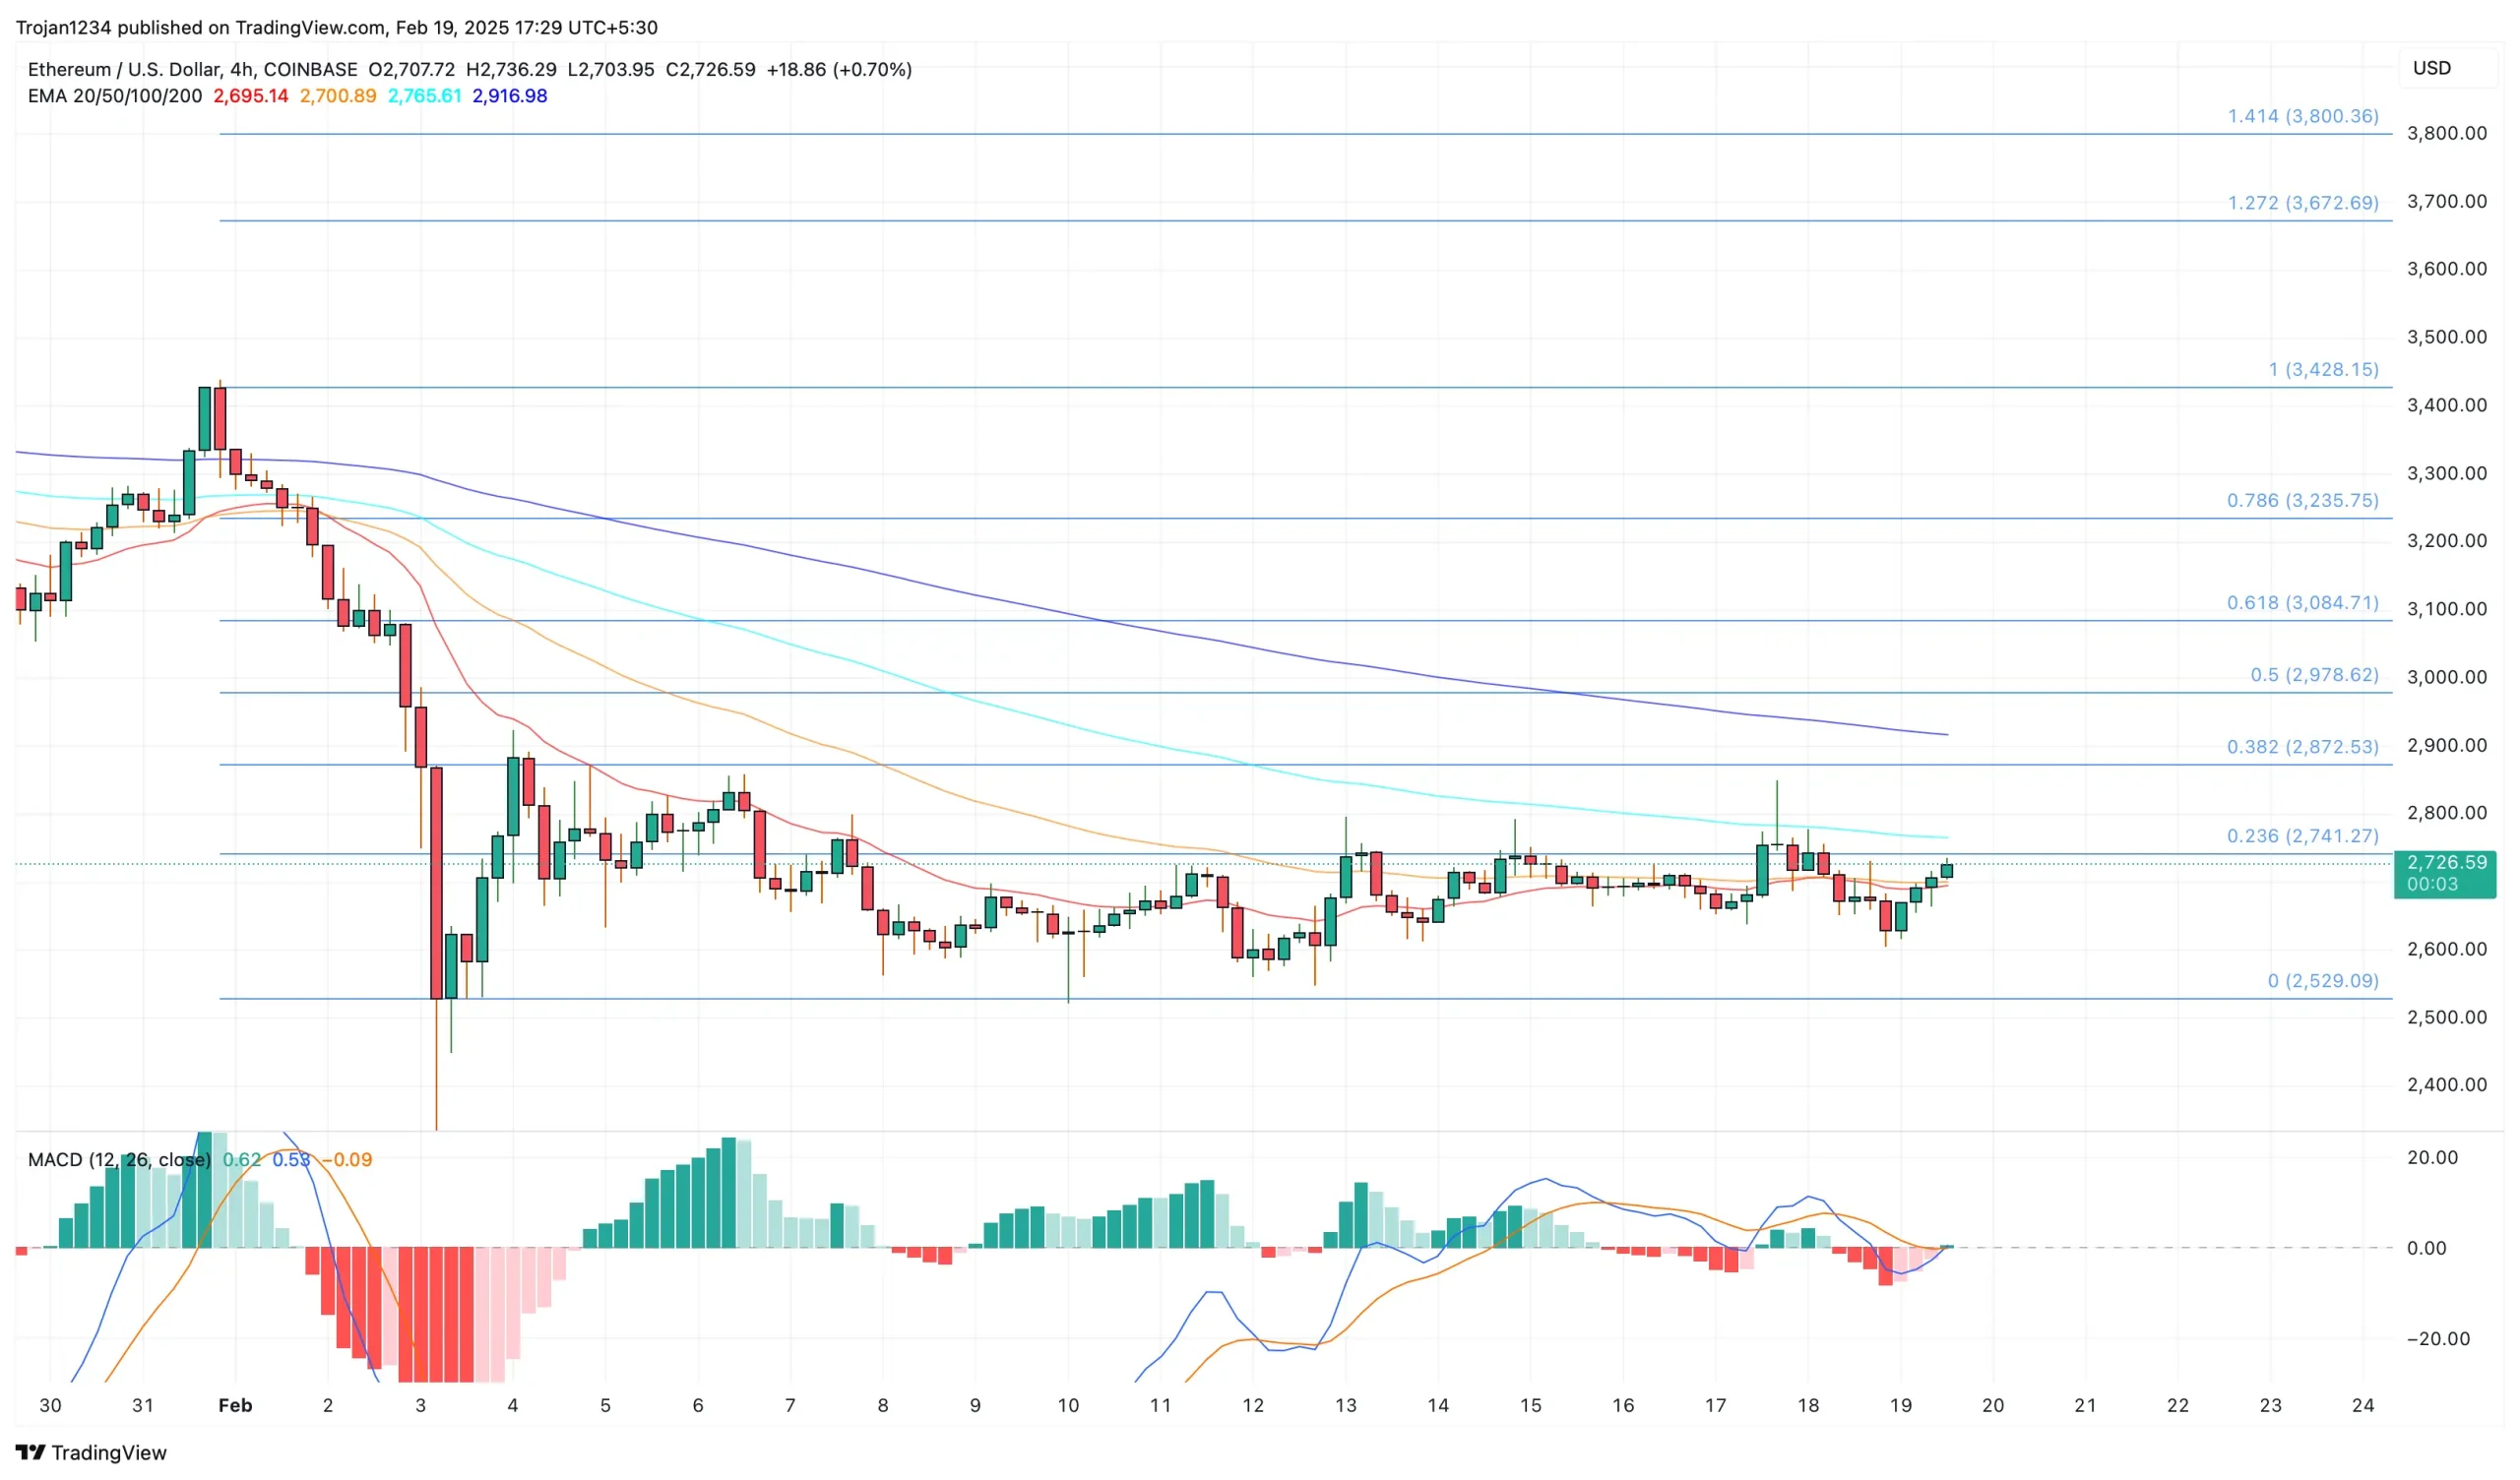
As Bitcoin gradually recovers to cross above the $96,000 mark, Ethereum is on a recovering trend. With four consecutive bullish candles in the 4-hour chart, the Ethereum price has crossed above the $2,700 level.
Aiming for a new bullish reversal, the ETH price trend is close to challenging the 100-EMA line, acting as a dynamic resistance.Will this breakout rally propel Ethereum above the $3,000 mark? Let’s find out.
Ethereum Price Action Aims Range Breakout
In the 4-hour price chart, the Ethereum price trend reveals a sideways shift below the 23.6% Fibonacci level. This crucial resistance level is priced at $2,741, while the lower support for the consolidation range is priced at $2,529.
With multiple rejections from this level, Ethereum has made a lower high trend to challenge the upper ceiling. The recent recovery in Ethereum has surpassed the 20 and 50 EMA lines of the 4-hour chart.
Currently, Ethereum is priced at $2,723 after its four consecutive bullish candles.
Challenging the overhead resistance with newfound momentum, the MACD indicator reveals a positive crossover with the surge of bullish histograms. Hence, the momentum indicator suggests the possibility of a new breakout rally.
However, the 100-EMA line in the 4-hour chart has provided dynamic resistance once before. Ethereum must find a closing price above the 23.6% Fibonacci level and the 100-EMA line at $2,764 for a sustained recovery.
Analyst Targets ETH Rally to $4k
Supporting the bullish chances of a sharp recovery, Ted Pillows, a crypto analyst, highlights a strong possibility of a bullish move. According to his recent tweet, Ted expects Ethereum to surge within an ascending triangle pattern formed in the 2-week price chart.
Currently, Ethereum has taken support from the support trendline, which will likely provide its fifth bullish reversal. With the bullish recovery, the triangle breakout rally will likely propel Ethereum towards the $4,000 mark.
Key Price Targets For Ethereum Breakout Rally
With the bullish breakout, Ethereum will likely attempt to challenge the 50% Fibonacci level near the $3,000 psychological level. Beyond this, the Fibonacci levels at $3,418 and $3,672 remain key targets.
On the flip side, the crucial support remains near the $2,600 mark and $2,529 horizontal level.
Credit: Source link
