
Precious metals trading has been wild
- Gold prices (/GCG4) surged to all-time highs at the start of the trading week, only to register a sharp decline between Monday and Tuesday.
- Silver prices (/SIH4) have not stabilized like their golden counterpart, down nearly 6% this week.
- A continued drop in U.S. Treasury yields bodes well for precious metals, with a caveat.
It’s been a jarring few days for precious metals traders.
After gold prices (/GCG4) surged more than 4% on Sunday evening and silver prices (/SIH4) added more than 2%, the precious metals came crashing back to earth in a deleterious fashion.
What caused the spike and collapse? Maybe it was a fat finger, maybe it was the result of stop orders getting cleared out, maybe it was fear around weekend headlines about conflict in the Red Sea. Context matters, but the price action speaks for itself: /GCG4 and /SIH4 have turned solid gains into meaningful losses at the start of December.
Price divergence between gold and silver
There is a divergence between the precious metals, however, even as U.S. Treasury yields continue to grind lower to multi-month lows. While the gold has stabilized, the more speculative, cyclically sensitive silver has been unable to stem the bleeding.
Granted, falling yields—both in nominal and real terms–should be a positive tailwind for precious metals, the fact is that it appears that financial markets are increasingly pricing in a global recession. For evidence, see crude oil (/CLF4), copper prices (/HGH4), and the 10-year yield (/10Y).
/GC gold price technical analysis: daily chart (April to December 2023)
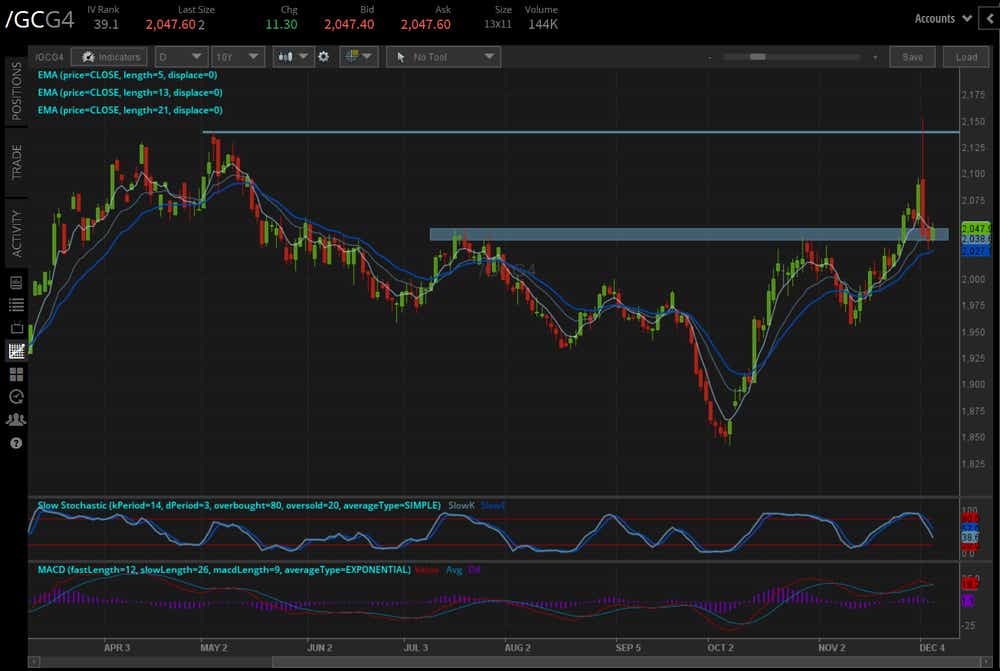
The decline in /GCG4 from its all-time high has led to prices stabilizing around $2,040. Here, stability is the only goal.
Momentum has been damaged, with slow stochastics trending lower out of overbought territory and moving average convergence divergence (MACD) issuing a bearish crossover (albeit above its signal line). A bearish MACD crossover happens when the difference between short-term and long-term moving averages crosses from above to above the signal line.
That said, /GCG4 is holding above its daily exponential moving average (EMA) envelope, which is still in bullish sequential order. The technical picture is muddled, but bulls still have a fighting chance at this juncture.
/SI silver price technical analysis: daily chart (March to December 2023)
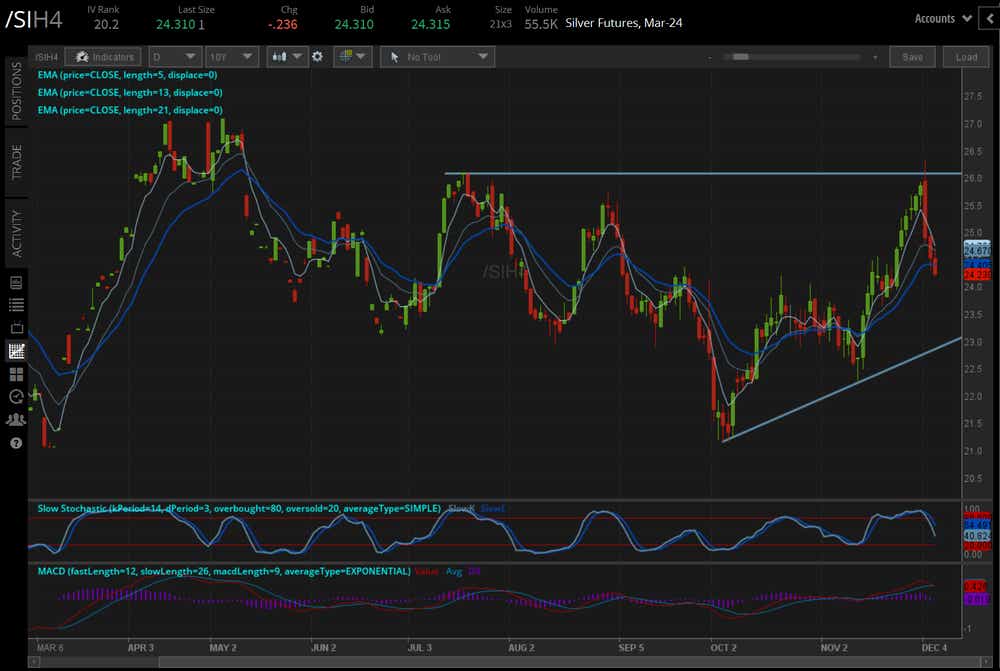
Unlike /GCG4, /SIH4 has sustained a significant pullback from the highest levels seen in May. Momentum has cracked, with /SIH4 below each of its daily 5-, 13-, and 21-day EMAs.
Slow stochastics are trending lower out of overbought territory, and MACD has issued a bearish crossover (albeit above its signal line). A more serious setback may be afoot, putting into focus the rising trendline from October and November swing lows, closer to $23.
If growth concerns continue to percolate, then we may be seeing gold prices outperform silver prices in the coming weeks.
Christopher Vecchio, CFA, tastylive’s head of futures and forex, has been trading for nearly 20 years. He has consulted with multinational firms on FX hedging and lectured at Duke Law School on FX derivatives. Vecchio searches for high-convexity opportunities at the crossroads of macroeconomics and global politics. He hosts Futures Power Hour Monday-Friday and Let Me Explain on Tuesdays, and co-hosts Overtime, Monday-Thursday. @cvecchiofx
For live daily programming, market news and commentary, visit tastylive or the YouTube channels tastylive (for options traders), and tastyliveTrending for stocks, futures, forex & macro.
Trade with a better broker, open a tastytrade account today. tastylive, Inc. and tastytrade, Inc. are separate but affiliated companies.
Credit: Source link