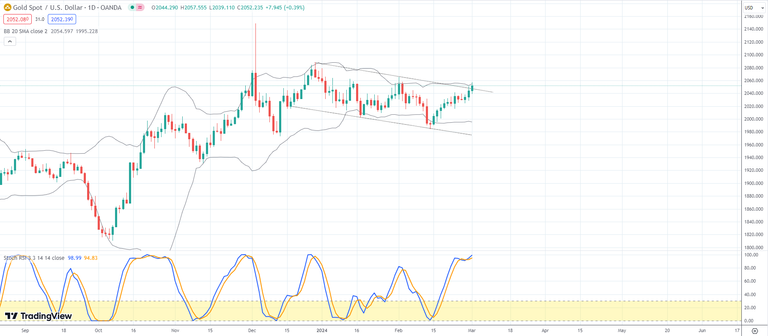
(Kitco Commentary) – On Wednesday I wrote that I expected gold to hit the 2050/55 price with a touch of the top Bollinger band; that occurred in overnight trading. Whether bulls will successfully hold the breakout however remains to be seen; updated daily chart below.
Note the relative strength oscillator in a stretched position. Bulls want it to stay that way, such as in the period from mid-October to early November 2023. Again, to me bulls should get the benefit of doubt till proven otherwise.
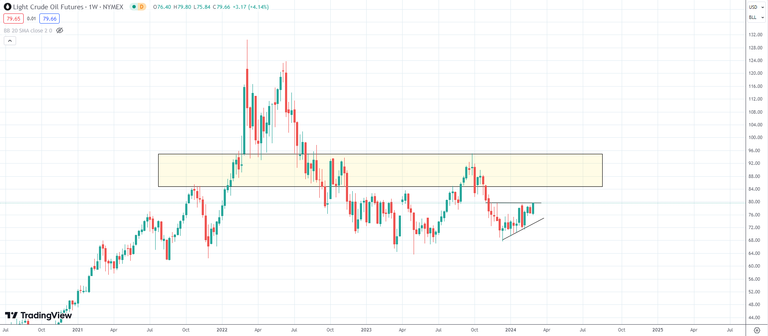
I mentioned the macro-economic and social political environment as adding weight to the bullish case for gold. Another chart that looks primed to move on a catalyst (yet unknown), in my opinion is oil. WTI on the weekly chart below, looks just about ready to break out above $80 in my opinion. If bulls can get price into the yellow box, then the probability becomes a move all the way to the top, with a target of 95.

Of course, the stock market continues to be resilient. As I mentioned Wednesday, my expectation is for a correction, but let me clarify that I would under no circumstances take an active short position against indices, that is, until the FED clearly signals a cut, with commensurate odds signaling it as a done deal.
The flip in monetary policy from where we are now, to easing, I think is shaping up to be an EPIC sell the news event.
Thanks and have a nice weekend.
Disclaimer: The views expressed in this article are those of the author and may not reflect those of Kitco Metals Inc. The author has made every effort to ensure accuracy of information provided; however, neither Kitco Metals Inc. nor the author can guarantee such accuracy. This article is strictly for informational purposes only. It is not a solicitation to make any exchange in commodities, securities or other financial instruments. Kitco Metals Inc. and the author of this article do not accept culpability for losses and/ or damages arising from the use of this publication.
Credit: Source link
