eth-usd
In today’s Asian market, Gold’s price action remains muted above the $1,990 level, with the precious metal stabilizing slightly above recent two-month lows. The unexpectedly high US inflation figures have recalibrated market expectations, delaying predictions for a Federal Reserve rate cut to mid-year, presenting headwinds for Gold, traditionally non-yielding.
-
🏆 10 Best Forex Brokers
-
Interest Rate Dynamics and Gold’s Path
The Federal Reserve’s hawkish stance shores up the US Dollar, curtailing any significant gains for Gold. Despite this, a dip in US Treasury yields checks the Dollar’s momentum, offering some reprieve for Gold prices.
The subdued appetite for Gold, exacerbated by the US inflation report, suggests a downtrend for XAU/USD, rendering any recovery vulnerable to sell-off pressures. Market participants now await further US economic data to drive momentum.
Geopolitical Tensions and Economic Data Influence
With the Fed’s interest rate cut expectations adjusted, the focus shifts to upcoming US economic releases, including Retail Sales and key manufacturing indices, which could offer new directional cues for Gold prices.
The geopolitical landscape also remains in focus, with developments in the Middle East potentially influencing Gold’s safe-haven appeal.
As the market digests various economic indicators, Gold’s trajectory will likely reflect the interplay between these factors and the prevailing market sentiment.
Events Ahead: Geopolitical Risks and Data Releases
Geopolitical risks, underscored by increased tensions in the Middle East, could provide some support for gold as a safe-haven asset.
The market is also poised for the release of key U.S. economic data, including Retail Sales and the Philly Fed Manufacturing Index, which will likely influence gold’s short-term direction.
These upcoming indicators, coupled with the ongoing geopolitical dynamics, are expected to be critical in shaping gold’s pricing and investment appeal in the sessions ahead.
Gold Price Forecast: Technical Outlook
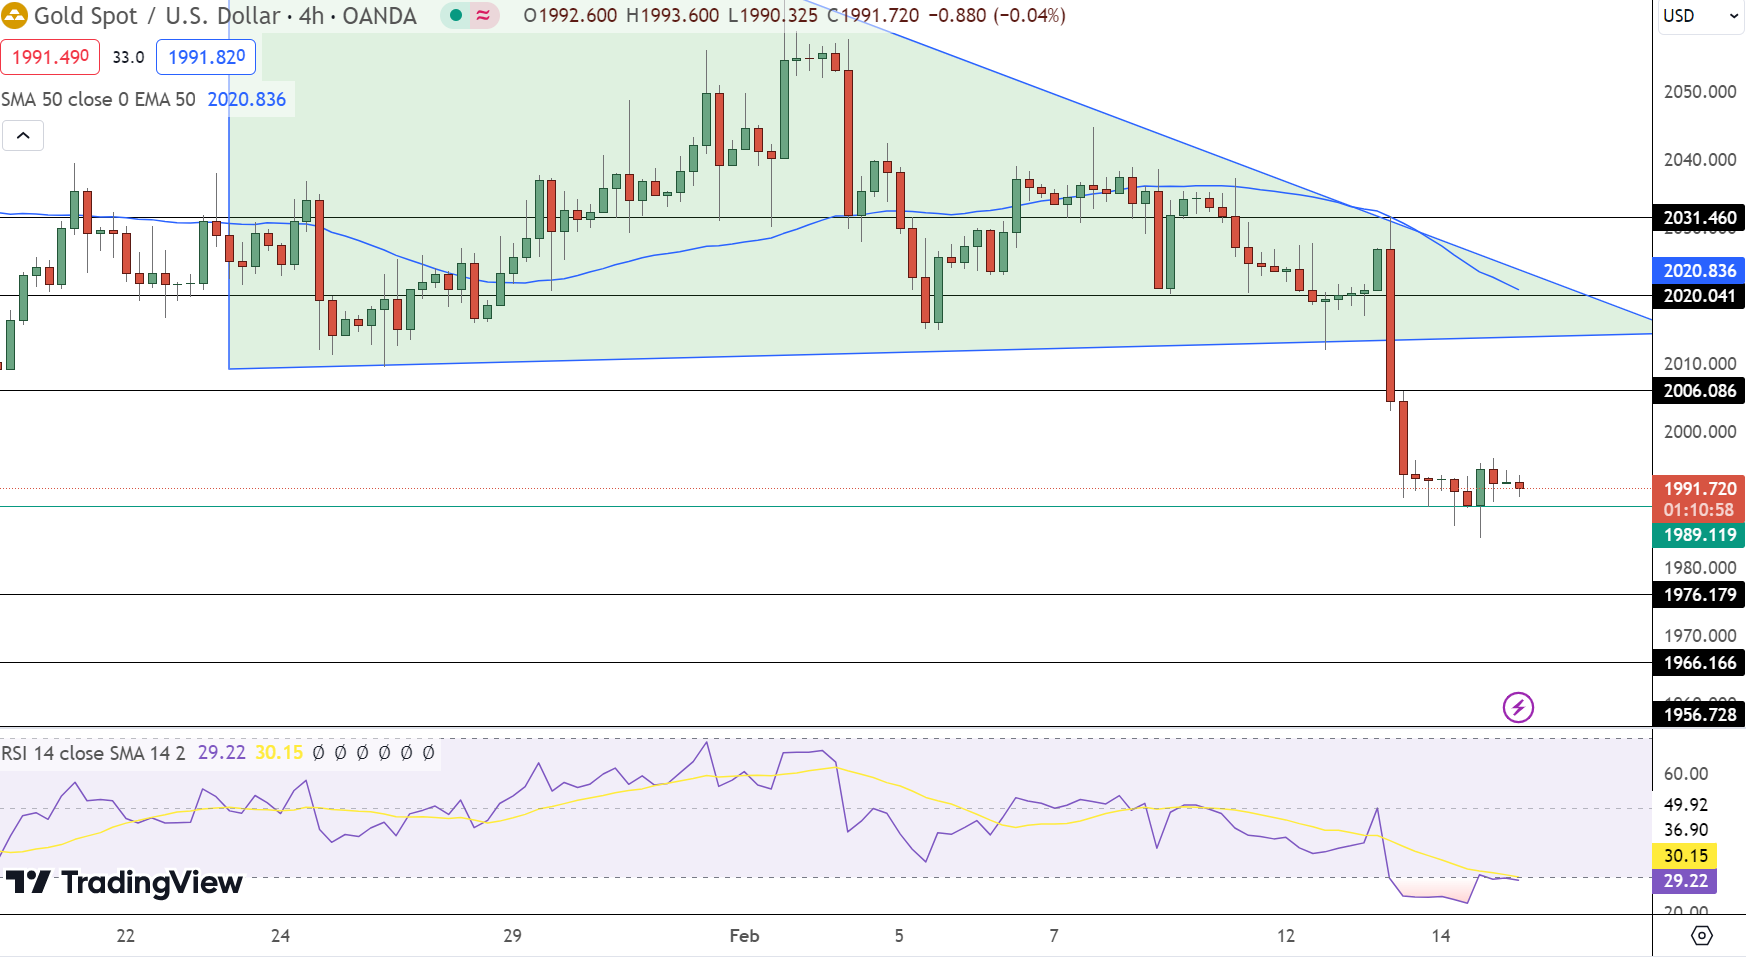
Gold exhibits marginal movement, with the current price at $1,991.72, showing a negligible change of 0.01%. The precious metal’s technical are drawn around a pivot point at $1,989.12.
Should gold advance, it would encounter resistance at $2,006.09, followed by $2,020.04, and then at $2,031.46. Support levels are etched at $1,976.18, $1,966.17, and further down at $1,956.73.
The Relative Strength Index (RSI) stands at 29, nearing the oversold territory, which might suggest an upcoming reversal. Meanwhile, the 50-day Exponential Moving Average (EMA) at $2,020.84 is just above the current price, indicating potential resistance.
Chart analysis shows gold hovering above its pivot, consolidating with neutral candle formations as the market anticipates retail sales data from the US.
Credit: Source link

