Precious metals are off to a rocky start in 2024 as the number of interest rate cuts by the Federal Reserve are called into question. The Dollar Index has shown significant resiliency, bouncing off the 100 handle to the best start in nearly two decades. Eurozone inflation has unexpectedly rebounded in December to 2.9% from 2.4%, trimming the chances of a March ECB rate cut from 70% on Thursday to 40% on Friday. The U.S. Payroll report showed an unexpected increase of 216k jobs created versus the consensus of 170k, leaving us with a 50/50 chance of a rate cut in March. Equity markets are in jeopardy of snapping a nine-week winning streak, and what was once “tailwinds” from the October lows have now become “tailfumes.” Where does this leave us?
The Federal Reserve claims to be “data dependent,” however, with an election year upon us and not to be political, it appears the current administration is willing to “pull out all the stops” to maintain power. I believe Jerome will get a call on his “burner phone” to ease the strain of higher borrowing costs and switch on the “afterburners” of this economy with a series of rate cuts. Of course, I don’t want to downplay the risks of “higher for longer,” but if a rate cut comes in March, what’s to say the Fed doesn’t provide a few additional “insurance cuts” to get the job done and keep “the big man in office.” Either way, it will be an exciting, volatile, and outright “crazy” 2024.
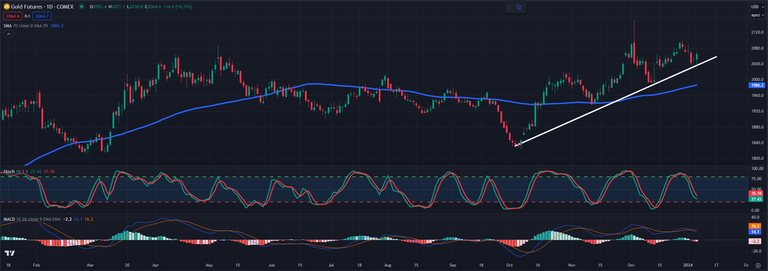
Daily Gold Chart
Despite the weakness earlier in the week, the technicals were constructive for Gold, with prices bouncing firmly off of the 50 DMA at $2029. The chart pattern maintains the “Golden Cross,” where the 50 DMA exceeds the 200 DMA. Traders will note that critical pocket support remains between $2013 and the psychological $2000 level. Resistance on the charts remains at $2098, where any breach above on a closing basis should trigger the next wave of short covering followed by fresh buying. Momentum studies have been declining but not into oversold territory.
Having the flexibility to enter and exit the market quickly makes it essential for Precious Metals investors to have a futures trading account alongside their core Physical Precious Metals holdings. If you are interested in speculating on the rise and fall of the price of Precious Metals on a shorter-term basis, such as two weeks or two months, or If you have never traded futures or commodities, check out this new educational guide that answers all your questions on transferring your current investing skills into trading “real assets,” such as the 1000 oz Silver futures contract. You can request yours here: Trade Metals, Transition your Experience Book.
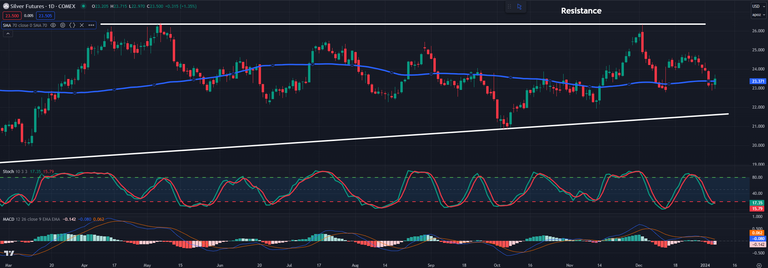
Daily Silver Chart
This week, Silver briefly dipped below what I call the “value zone.” Before you get all crazy on me and say anything under $50 or $100 is the value zone, I often look at a simple 70 DMA, giving me a rolling two-month picture of where we are in prices. I overlay that with several momentum indicators and then apply that to current projections on supply and demand for the coming calendar year. That pivot line occurs at the $23 mark, where I would “dip a toe in the water” on new positions and then use the arbitrary strategy of adding every $1 lower down to $20 per ounce. On the upside, I see $25 and above as a level to lighten the load while maintaining some “core position.” Everyone will see differently; please use your judgment on position sizing and risk parameters.
To help you develop a technical trading strategy, we have recently updated our “5-Step Technical Analysis Guide,” which will provide you with all the Technical analysis steps to create an actionable plan used as a foundation for entering and exiting the market. You can request yours here: New 5-Step Technical Analysis Guide.
Disclaimer: The views expressed in this article are those of the author and may not reflect those of Kitco Metals Inc. The author has made every effort to ensure accuracy of information provided; however, neither Kitco Metals Inc. nor the author can guarantee such accuracy. This article is strictly for informational purposes only. It is not a solicitation to make any exchange in commodities, securities or other financial instruments. Kitco Metals Inc. and the author of this article do not accept culpability for losses and/ or damages arising from the use of this publication.
Credit: Source link

