Calling a top is difficult, especially in a raging bull move such as we have seen, but there is something to be said for discipline in this game; the spot 2335 target I suggested at the beginning of March has been exceeded by 30$.
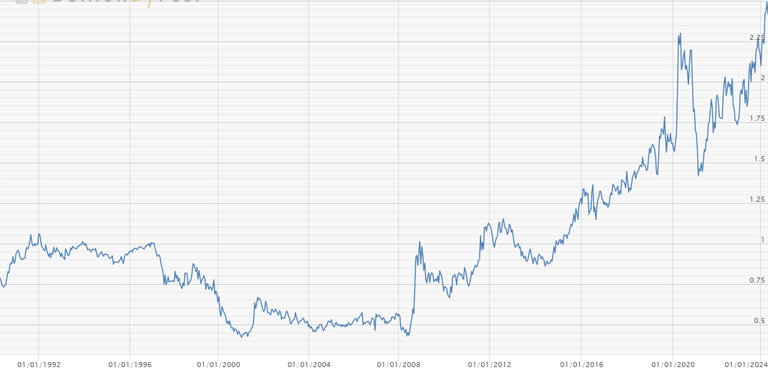
- Bullish sentiment in the metals sector is fervent
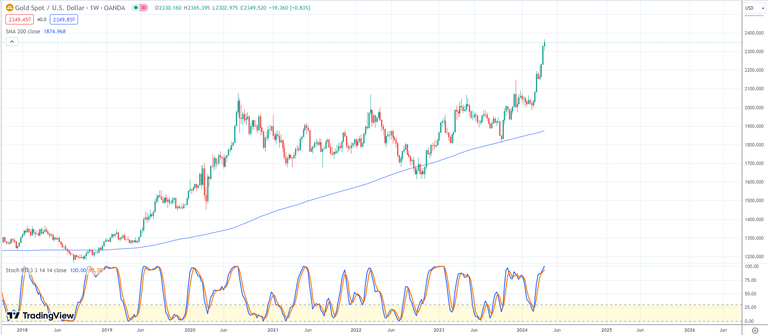
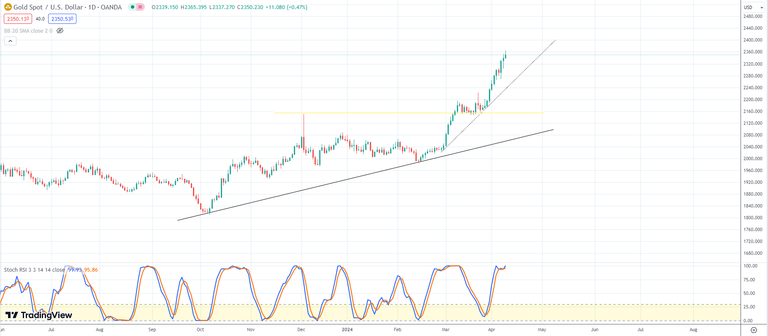
- Momentum indicators on weekly and daily timeframes are stretched
- Gold is far above ( historically) its 200-week moving average
Last week, I noted that I would be looking at momentum and price for signs that a top may be near. In my opinion, the move in metals is due for an imminent correction, and it may be a harsh one. The below daily and weekly gold charts illustrate the above points as well as present some potential downside targets. Note that potential downside targets remain above key breakout points, with the exception of the closest, light trendline, which has a higher probability of acting as only minor support.
Daily:
Weekly:


Some preparation for defensive action is a good idea as evidence begins to mount that gold and silver may be at or approaching a temporary top.
Thanks, and good luck.
Disclaimer: The views expressed in this article are those of the author and may not reflect those of Kitco Metals Inc. The author has made every effort to ensure accuracy of information provided; however, neither Kitco Metals Inc. nor the author can guarantee such accuracy. This article is strictly for informational purposes only. It is not a solicitation to make any exchange in commodities, securities or other financial instruments. Kitco Metals Inc. and the author of this article do not accept culpability for losses and/ or damages arising from the use of this publication.
Credit: Source link
