
SILVER, GOLD OUTLOOK:
- Gold and silver prices have retreated in recent weeks, but their outlook remains constructive
- If bond yields continue to push lower, precious metals could shine heading into 2024
- This article explores XAU/USD and XAG/USD’s key levels to watch this week
Trade Smarter – Sign up for the DailyFX Newsletter
Receive timely and compelling market commentary from the DailyFX team
Subscribe to Newsletter
Most Read: US Dollar Setups – EUR/USD Defies Support After Pullback, USD/JPY Stands Tall
Gold and silver have declined over the past couple of weeks as the geopolitical premium built up in both metals after the Hamas terrorist attacks on Israel early last month have started to unwind. This is because the situation in the Middle East, while still tragic, has not degenerated into a wider conflict involving other countries, such as Iran or Lebanon.
Another factor that has contributed to the weakness in XAU/USD and XAG/USD is reduced demand for safe-haven positions. Recently, U.S. stocks have gone on a bullish tear, with the Nasdaq 100 rising for eight consecutive sessions and on the verge of reclaiming its October high. Fear of missing out has, therefore, pushed traders to redirect their attention on the equity market rather than on non-yielding assets.
Despite recent market dynamics, there are reasons to be optimistic about precious metals. That said, one catalyst that could put upward pressure on their prices is the pullback in rates. Last month, the US 10-year yield topped 5.0%, but has since corrected sharply lower, falling below 4.6% today. If this correction accelerates in the near term, the backdrop for both gold and silver would become more constructive.
Eager to gain insights into gold’s future trajectory and the upcoming market drivers for volatility? Discover the answers in our complimentary Q4 trading guide. Download it for free now!
Recommended by Diego Colman
Get Your Free Gold Forecast
GOLD PRICE TECHNICAL ANALYSIS
Gold has seen a modest retreat in recent days after failing to take out resistance in the $2,010/$2,015 range late last month. If losses deepen in the coming trading sessions, support appears at $1,960, followed by $1,945, near the 200-day simple moving average. While there’s potential for the metal to find stability in this area before making a comeback, a breakdown could open the door for a move toward $1,920.
On the other hand, if the bulls engineer a resurgence and propel prices upward, overhead resistance is located at $2,010/$2,015 as mentioned earlier. Upside clearance of this technical barrier would reignite bullish sentiment, setting the stage for a rally towards $2,060. On further strength and sustained momentum, buyers may gain the confidence to challenge this year’s high at $2,085.
GOLD PRICE CHART (FRONT-MONTH FUTURES)
Source: TradingView
Wondering how retail positioning can shape silver prices? Our sentiment guide provides the answers you seek—don’t miss out, download it now!
| Change in | Longs | Shorts | OI |
| Daily | 8% | -8% | 6% |
| Weekly | 7% | -8% | 5% |
SILVER PRICE TECHNICAL ANALYSIS
Silver sold off on Tuesday, sinking towards confluence support around $22.55, where a medium-term ascending trendline converges with several recent swing lows. Buyers must firmly protect this area to counteract the current selling pressure. Failing to maintain this floor could potentially push prices down to $22.20. In case of continued weakness, the focus shifts to October lows near the $21.00 mark.
Conversely, if buyers return and trigger an upside reversal, we could see a move toward trendline resistance at $23.40. This pivotal level, which coincides with the 200-day simple moving average may establish a robust barrier against bullish advances, but in the event of a breakout, XAG/USD may progress towards the $24.00 threshold.
SILVER PRICE CHART (FRONT-MONTH FUTURES)
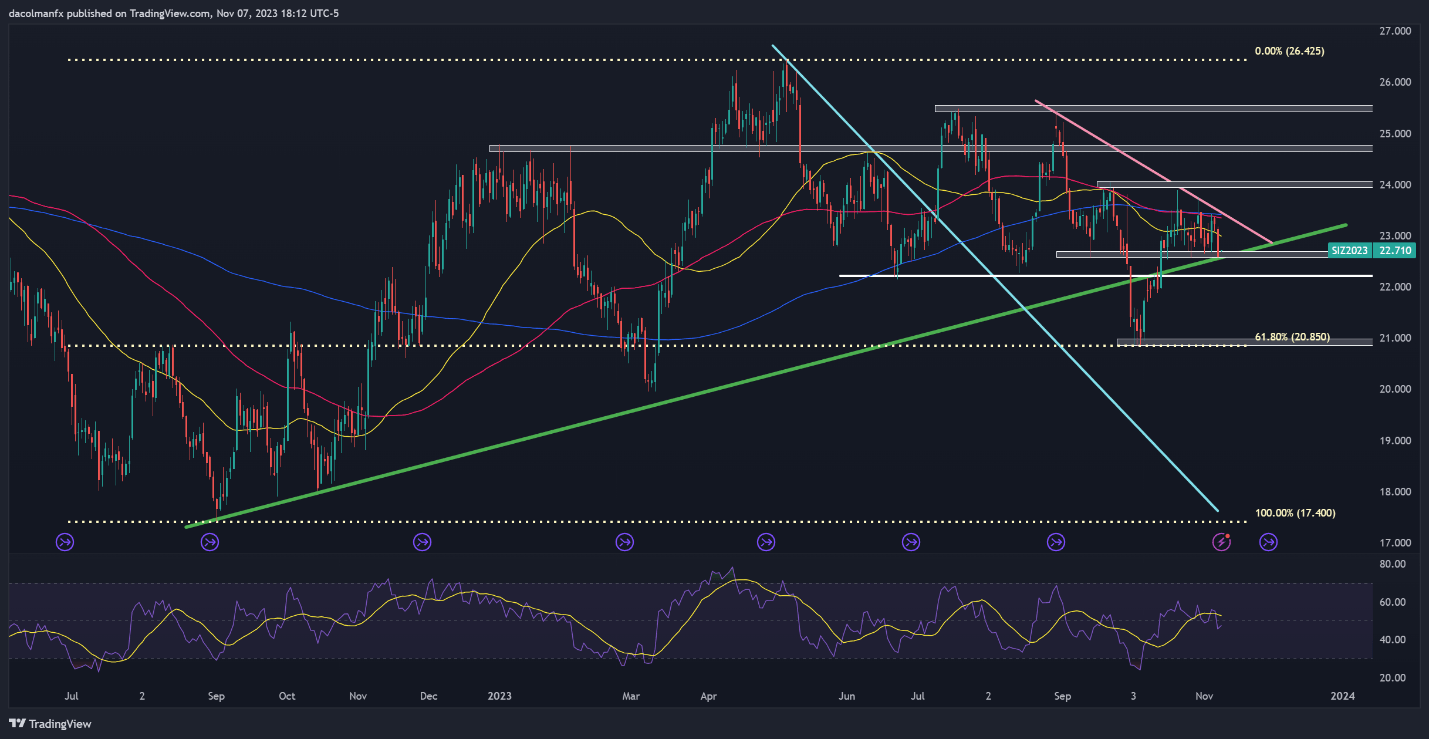
Source: TradingView
Credit: Source link