- The Bitcoin price recovery gives a bullish breakout from multi-month resistance of $94,830, signaling an opportunity for renewed recovery in short-term trend.
- Retail-sized Bitcoin transfers (below $10K) have slipped into negative growth over the past 30 days
- The relative strength index (RSI) at 66% accentuates a positive sentiment among market participants and builds bullish momentum for potential recovery.
The pioneer cryptocurrency Bitcoin jumped over 3.36% during Tuesday’s U.S. market hours to reach $94,318. The buying pressure followed the recent release of December 2025 US CPI data, which came in line with market expectations, easing fear of renewed inflationary pressure. With renewed inflows from BTC ETFs, the Bitcoin price is heading for a bullish breakout from key resistance.
On-chain data Signals Weak Retail Demand Behind BTC’s Latest Surge
After a week long of consolidation, the Bitcoin price witnessed a strong spike in buying pressure today, resulting in a 3.5% surge and reaching a trading value of $94,365.
Another look on BTC’s on-chain analysis shows a notable change in transaction patterns. Data provided by CryptoQuant Analyst suggests that transfers worth between zero and 10,000 US dollars, which are often linked to individual participants, have been in decline over the past 30 days.
This metric on recent visualizations, depicted in red, dipped into negative values indicating reduced activity from smaller-scale movers.
Meanwhile, Bitcoin’s valuation, which is followed by the white lines across the timeline from mid-2021 to early 2026, lies high within its recent boundaries. The overall amount of such transactions made up of small sizes of transactions and depicted in green, have been fluctuating but did not manage to continue with upward momentum in tandem with the price levels.
This setup is different from previous periods, such as 2021 and 2024, where similar charts showed tremendous growths in this demand indicator in the periods of major ascents.
Larger transactions appear to be taking over the picture, which may change the balance of factors affecting price stability. The lack of strong participation in the form of everyday transactors may leave the market subject to higher fluctuations when sentiment changes.
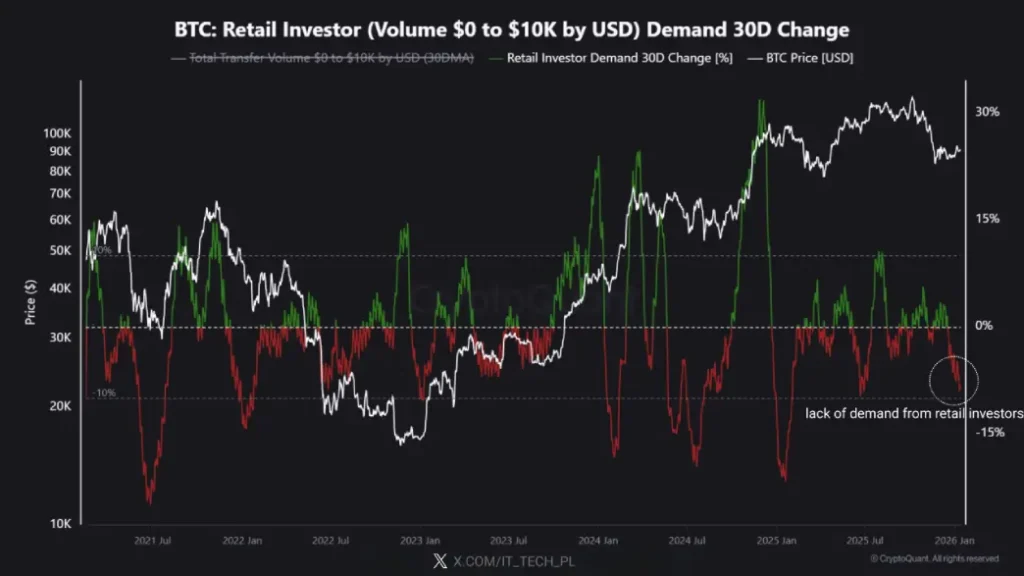
Observers note that historical data correlates vigorous small-transfer growth to more resilient expansions, although present conditions reveal a divergence. The graph also highlights certain points, such as a circled zone highlighting recent falls and emphasizing the changing dynamics in cryptocurrency flows.
Bitcoin Price Recovery To Hit Make-or-Break Ceiling at $98k
Over the past two months, the Bitcoin price has been trading in a sideways trend, struggling to sustain above the horizontal resistance of $94,830. The consolidation reflected the broader market uncertainty amid the macroeconomic jitters, irregular ETF inflows, tariff tension, etc.
However, with today’s jump, the coin price teases a bullish breakout from the $94,830 resistance. If the breakout sustains, the BTC could jump another 3% and challenge the resistance trendline of inverted flag pattern at $98,600.
The aforementioned resistance coinciding with the 200-day EMA slope indicates a high area of interest that could reverse the BTC price.
The inverted flag pattern is also a well-known bearish pattern as the short consolidation within its two ascending trendline has often recouped the selling momentum. Thus, the Bitcoin price holds a risk of bearish reversal from $94,830 resistance, which could signal the continuation of prevailing downtrend.
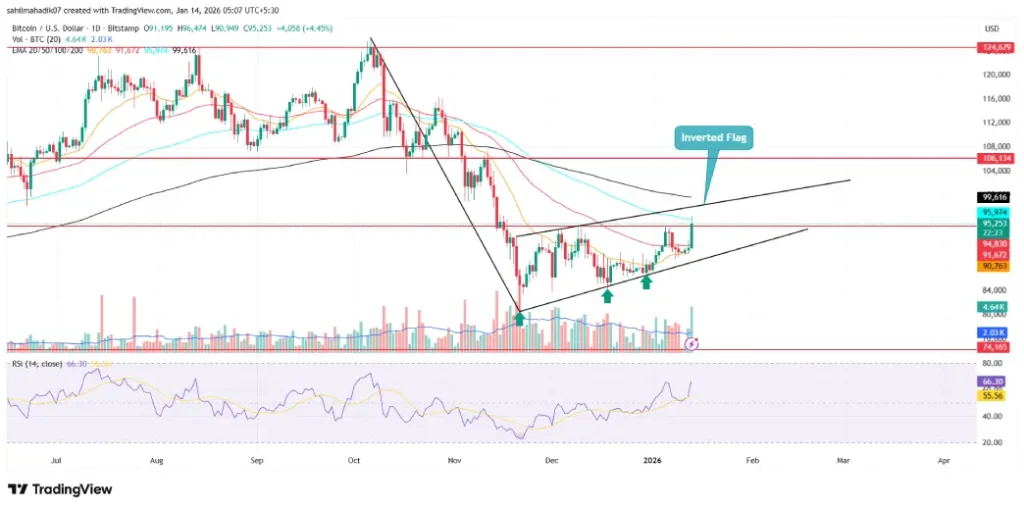
On the contrary, if the Bitcoin price breaks above the overhead trendline, the buyers could strengthen their grip over the asset for renewed recovery trend.
Credit: Source link