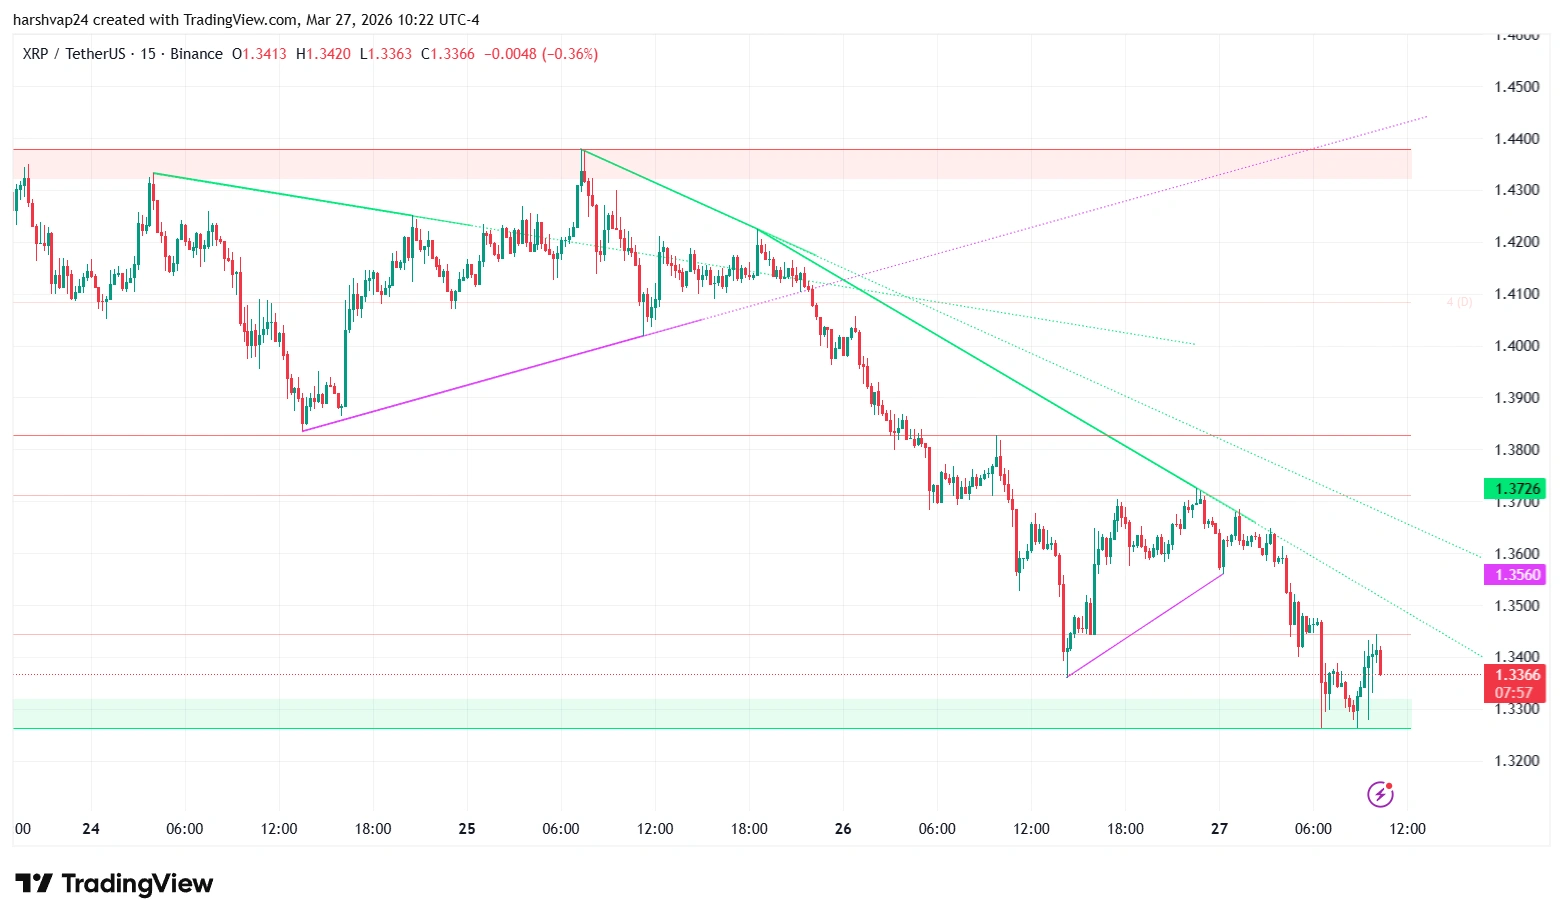
- Ripple price is stuck in a tight range near $1.34 after a 2.5% drop on a 24-hour time frame.
- $XRP is locked in a steep descending channel, with repeated rejections at $1.3650.
- RSI and MACD indicate a bearish momentum.
Ripple price is in a phase of range-bound movements, trading at $1.3357 after recording a 2.5% decline over the past 24 hours. The recent slide compounds a broader bearish trend for Ripple ($XRP), which is now down 7% on the weekly time frame and 6.5% over the past month.
Despite a massive market cap of $81.98 billion and $2.59 billion in 24-hour trading volume, $XRP is struggling. The uncertainty surrounding the U.S.-Iran geopolitical issue and the subsequent cashing out across traditional equities has created a difficult environment for high-cap altcoins.
Looking at Ripple Price Charts
A close examination of the 15-minute price chart reveals a descending channel controlling XRP’s price action in recent trading sessions. The visual data highlights a relentless series of lower highs and lower lows, perfectly contained by a sharply angled descending resistance trendline.
Every attempt by the bulls to mount a recovery rally has been aggressively pushed down at the $1.3650 level, confirming that sellers remain firmly in control of the short-term momentum. $XRP price then suffered a structural breakdown, turning support into resistance near the $1.3560 level. The drop below the support accelerated the selling pressure, pushing $XRP lower toward the $1.3263 level.
The 50-period Exponential Moving Average (EMA) has crossed decisively below the 200-period EMA on the lower timeframes, executing a localized death cross. This moving average alignment confirms that the immediate trend is heavily skewed to the downside
The Relative Strength Index (RSI) has plunged into the lower bounds of the chart and is hovering near the oversold threshold of 30. Currently, RSI doesn’t indicate signs of bullish divergence, suggesting seller exhaustion. Without this divergence, the RSI points to a heavy downward momentum, and that $XRP could sustain further losses before any kind of a relief bounce.
The Moving Average Convergence Divergence (MACD) indicator corroborates this bearish thesis. The MACD line has crossed below the signal line, and the accompanying histogram is printing expanding red bars, meaning the bearish momentum is actively growing on the 15-minute timeframe, making it difficult for an upward recovery.
What Does the Future Hold for Ripple?
If the broader macroeconomic fear continues to grip the markets, the Ripple price is highly likely to drop even more. The immediate area of concern for bulls is the fragile support near the $1.3300 level. In this bearish scenario, technical indicators suggest that $XRP could quickly sweep liquidity pools resting lower in the $1.30 to $1.28 regions.
For the bulls to regain control of the narrative, the Ripple must muster the buying volume necessary to pierce and close above the prominent descending resistance line that has pushed the $XRP price lower. A decisive breakout above this dynamic barrier, coupled with a bullish crossover on the MACD and a reclaim of the lost $1.3560 support level, would invalidate the immediate bearish technical structure.
Also Read: Filecoin Price Slides 3% as Risk-Off Sentiment Shakes Crypto
Credit: Source link