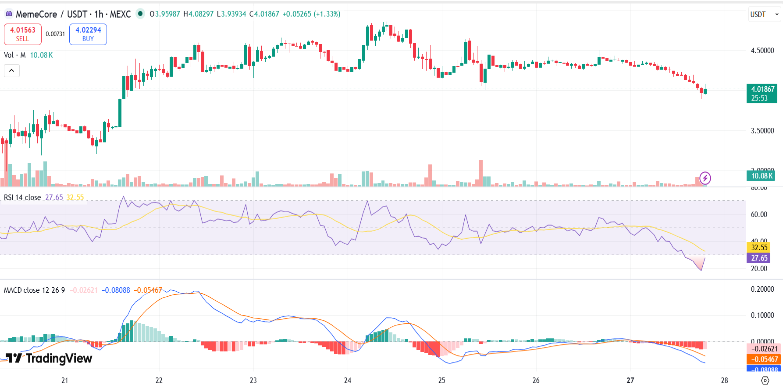
- On Monday, MemeCore (M) price crashed by around 10%, declining its value from $2.16 to $4.0 with $5.2 billion in market capitalization.
- The drop in the cryptocurrency follows heavy selling pressure after recently touching a new all-time high, along with a correction in the overall crypto market.
- Amid the crash in the price, the cryptocurrency has now entered the oversold territory.
On April 27, MemeCore (M) price experienced a correction after a 10% drop on a daily chart, breaking its upward momentum.
In the last 30 days, the MemeCore has soared by around 82%, helping its value to soar from $2.16 to $4.0. This drop in the cryptocurrency was expected after experiencing a month-long rally despite serious allegations on the project from ZachXBT, one of the popular on-chain sleuths.
At the time of writing this, MemeCoreM-11.57% is trading at around $4.02 with a drop of around 8% in the last 24 hours, according to CoinMarketCap. The cryptocurrency currently holds a market capitalization of around $5.2 billion with a daily trading volume of $19.38 million, which has soared by around 47%.
MemeCore Price Dips As Crypto Market Turns Cautious
The drop in M price comes after facing a rejection at $4.40. There are many factors behind the crash in the M price. It comes with a correction in the overall crypto market after a long rally in the last few weeks.
M has surged more than 20% in a single day and more than 50% across some weeks earlier in April. This surge was mainly supported by network developments, including a hard fork, which reduced gas fees.
Amid such major developments on the network, traders have started accumulating the cryptocurrency. They are selling their tokens to book profits. This is a very common pattern in the memecoin sector, where the cryptocurrency soars sharply and then falls dramatically.
Adding to this, there is another controversy brewing in the crypto sector. Recently, the prominent on-chain investigator, ZachXBT, has raised some serious questions about its token distribution and tokenomics, sparking fear in its community.
He questioned why insiders or team-linked wallets appear to control a very large share of the supply, with some analyses citing figures as high as 90%. He challenged the project to explain its multi-billion dollar valuation, but real circulating liquidity remains thin. This sparked fear in the crypto community, and some people have started comparing it to other meme tokens like RAVE that collapsed after similar scrutiny.
However, the MemeCore team has not officially responded to this claim. The team is continuously expanding its network with the new development.
Apart from this, the overall crypto market has also pulled back as Bitcoin (BTC) price dropped by around 1.64%, slipping below $77,000 amid rising geopolitical tensions, including developments involving the United States and Iran.
MemeCore Price Chart Shows Classic Correction After Parabolic Move
MemeCore price is currently following a classic correction pattern after hitting the all-time high. According to TradingView’s price chart, the cryptocurrency is currently breaking out of a tight ascending channel that has held since early April, with higher lows forming on each pullback.
After the M price touched the $4.84 level, the upward momentum started losing its momentum as sellers stepped in to book profits.
The chart has not broken major support levels around $3.80, but the speed of the drop shows that the rally had become overextended.
According to the current price chart, the 14-day relative strength index is currently revolving around 16, reaching the extreme oversold territory.
Apart from this, the short-term moving averages are giving a sell signal, while longer averages like the 20-period and 50-period remain supportive of the overall uptrend.
Also Read: Pi Network Price Up 2% as Mining Lead and Upgrade Shape Bullish Setup
Credit: Source link