Close Menu
  • Home
  • Crypto News
  • Tech News
  • Gadgets
  • NFT’s
  • Luxury Goods
  • Gold News
  • Cat Videos
What's Hot

Funny cat video short clip | funny cat videos for cats to watch #cat #comedy #shorts

August 23, 2026

Is A Liquid-Cooled PC Worth It?

August 23, 2026

Standard Chartered Forecasts Bitcoin Will Retest All-Time High

August 23, 2026
Facebook X (Twitter) Instagram
  • Contact Us
  • Disclaimer
  • Privacy Policy
  • Terms of Use
  • DMCA
Facebook X (Twitter) Instagram
KittyBNK
  • Home
  • Crypto News
  • Tech News
  • Gadgets
  • NFT’s
  • Luxury Goods
  • Gold News
  • Cat Videos
KittyBNK
Home » Bearish Pattern, Bigger Picture and Key Levels Revealed
Crypto News

Bearish Pattern, Bigger Picture and Key Levels Revealed

June 5, 2025No Comments2 Mins Read
Facebook Twitter Pinterest LinkedIn Tumblr Email
Bearish Pattern, Bigger Picture and Key Levels Revealed
Share
Facebook Twitter LinkedIn Pinterest Email

The price of XRP has been stuck in a tricky situation lately. While the long-term trend remains bearish, some short-term relief has appeared over the last few days. Let’s break down what’s happening with XRP right now.

XRP Still in a Pullback Phase

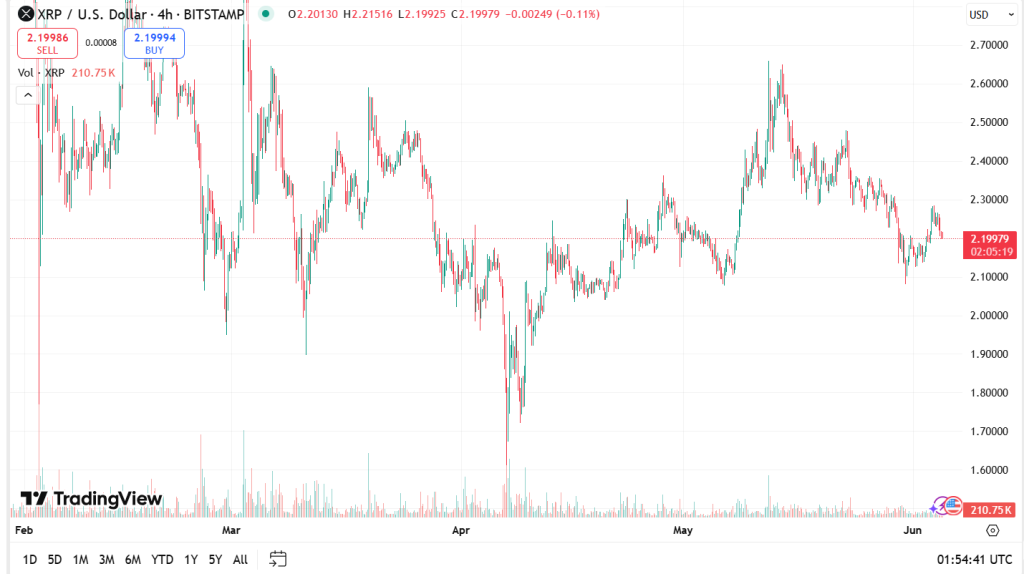
Currently, XRP is holding onto a support area between $2.10 and $2.15. This zone has attracted strong buying pressure, offering temporary stability after a series of bearish moves. However, unless the price manages to push past certain resistance levels, the risks for XRP remain on the downside.
Bearish Pattern, Bigger Picture and Key Levels Revealed
XRP price prediction

The immediate resistance stands between $2.30 and $2.34. If XRP can break through this level, the next hurdles are placed at $2.44 and then between $2.56 and $2.62. These are crucial areas to watch because a breakout above them could change the entire direction of XRP’s price trend.

Is a Bearish Pattern Forming?

If XRP gets rejected at the resistance between $2.30 to $2.34, it risks forming a head and shoulders pattern on the daily chart. This is a bearish sign and could drag XRP’s price well below $2.

To avoid this, XRP needs to close candles above $2.34, and ideally above $2.44. If that happens, it might even hint at a bigger bullish pattern called an inverse head and shoulders, which could lead to higher prices.

That said, there’s an important safety net for XRP bulls. As long as the price holds above the support zone between $1.21 and $1.55, the long-term bullish case remains intact. A fall below this area, however, would mean that a bigger correction is still unfolding.

What’s the Bigger Picture?

On a longer time frame, analysts are tracking XRP’s movement using Elliott Wave Theory. According to this, XRP might currently be in a fifth wave to the upside, aiming for much higher targets like $5.65 — but only if the market gains bullish momentum and breaks into new all-time highs.

Credit: Source link

Share. Facebook Twitter Pinterest LinkedIn Tumblr Email

Related Posts

Four Reasons Why Ripple’s Brad Garlinghouse Wants the Clarity Act to Pass

August 23, 2026

XRP Price Prediction: Breakout Above $1.55 Could Trigger Next Leg Up

August 23, 2026

South Korean Crypto Trader Return, Upbit Volume Explodes 273%

August 23, 2026

Hyperliquid Surpass Pump.fun in Fees as HYPE Token Hits ATH

August 23, 2026
Add A Comment
Leave A Reply Cancel Reply

What's New Here!

Litecoin Defends ETF Delay With 11% Surge above $90, Key Level To watch Is $100.

May 7, 2025

Improve your Excel Data Analysis with AI and EDA-GPT

July 24, 2024

Explore an ‘Entertainer’s Dream House’ this weekend in Naperville

October 3, 2023

Lake House on Canandaigua offering seaplane package for customers

September 22, 2023

Hands-On: Rolex GMT-Master II 126710GRNR ‘Bruce Wayne’ Watch For 2024

April 10, 2024
Facebook X (Twitter) Instagram Telegram
  • Contact Us
  • Disclaimer
  • Privacy Policy
  • Terms of Use
  • DMCA
© 2026 kittybnk.com - All Rights Reserved!

Type above and press Enter to search. Press Esc to cancel.