
- The Bitcoin price extends its short-term recovery momentum amid the formation of inverted flag patterns.
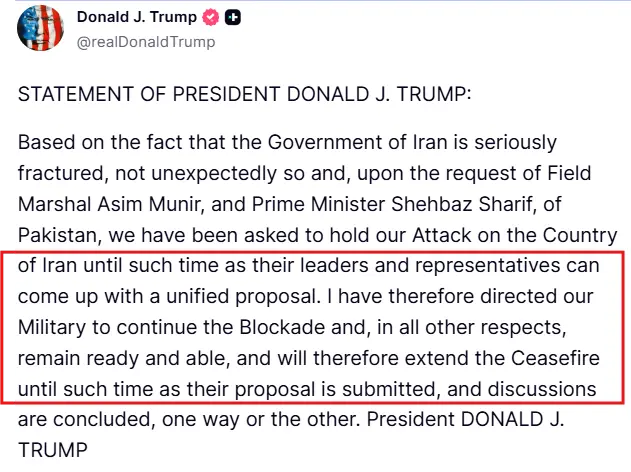
- Donald Trump announced a halt in the planned military strike on Tehran via a Truth Social update.
- Crypto fear and greed index at 33% indicate the broader trend remains under bear’s influence.
The pioneer cryptocurrency Bitcoin shows notable volatility during Tuesday’s market hours to trade at $75,568. The daily candle shows price rejection on either side indicating an uncertain market sentiment amid escalating geopolitical tension in the middle east. In addition, the on-chain data shows short-term holders have not yet reached capitulation, which historically acted as a reliable signal for Bitcoin price bottom. Will BTC lose $70,000 again?
BTC Volatility Rises as Trump Delays Iran Strike
In the last 24-hours, the Bitcoin BTC2.54% experienced notable volatility as its price fluctuated between $74,814 to $76,944 and settled around $75,818 with a neutral candle formation. A primary catalyst to this uncertainty was the escalating instability in the ceasefire between the U.S and Iran.
In a recent truth post, U.S. president Donald Trump mentioned that has opted to postpone the military attack on Tehran. This change of strategy is based on high-level requests made by the top leadership of Pakistan, namely the Prime Minister Shehbaz Sharif and the Field Marshal Asim Munir Trump who remarked that we have been requested to suspend our Attack on the Country of Iran until the time that their leaders and representatives can come up with a unified proposal.
This ruling is after Washington has alleged that the ruling body in Tehran is in a state of serious division. Although the direct threat of dropping bombs is put on hold, the Pentagon does not rest. Trump has ordered our Military to carry on with the Blockade in order to keep the pressure on the region.
U.S. troops are ordered to be prepared and available as diplomats hold on until the Iranian authorities can come up with a unanimous reaction. The President acknowledged that he will thus suspend the Ceasefire up until such a time when their offer is placed and all the associated talks are completed.
Bitcoin price Bear Cycle Persists Until STH–LTH Price Flip
While some traders watch simple price charts, on-chain analysts are tracking a specific crossover to signal the true end of the crypto winter. Alphractal chart indicate that the bear market in Bitcoin continues until a clear change in the cost basis of investors takes place. Specifically, “it will only end when the Short-Term Holder Realized Price drops below the Long-Term Holder Realized Price.
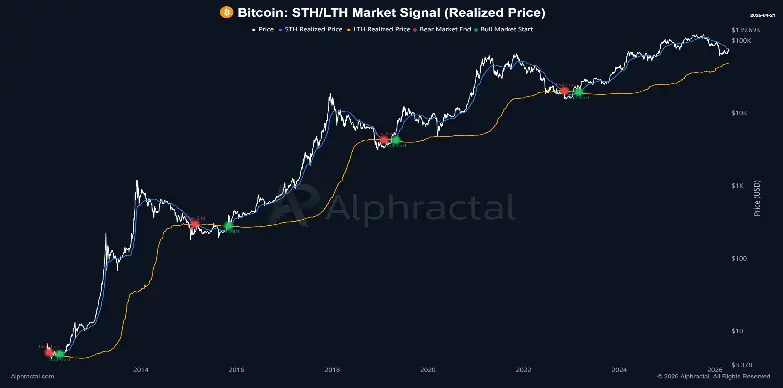
This measure is a historical macro-indicator. Observers add that that was the way it worked in earlier cycles, and so this is one of the main relationships on which market bottoms are timed. As a result, most are being instructed to “put your alarm on now to get this certain technical inversion.
Meanwhile, the Bitcoin price in the daily chart shows the formation of an inverted flag pattern. Over the past two months, the BTC rallied from $59,930 to $76,59, registering a 27% growth. This upswing resonating strictly within two parallel trendlines indicates a steady growth in price,
However, the chart setup is classic bearish continuation pattern, suggesting the ongoing recovery could bolster sellers to regain momentum. If history repeats, the Bitcoin price could plunge 9% and challenge the flag support at $69,300.
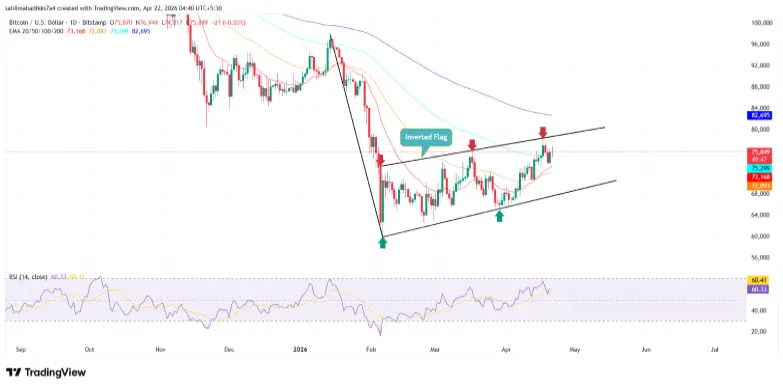
A potential breakdown below this support would further accelerate the Bitcoin price correction to $60,000.
Credit: Source link