- Bitcoin price fell 0.7% in 24 hours but recovered from lower levels.
- Santiment data showed BTC sentiment shifting from fear to strong FOMO.
- RVMM momentum stayed positive as Bitcoin held its rising channel.
This month, the Bitcoin price saw an uptick from its monthly low of $64K to a high of $79K. Since then, the BTC-0.85% has been trading within that support and resistance range as it attempts to break above $80K. However, each uptick has been challenged, with even rebounds taking place.
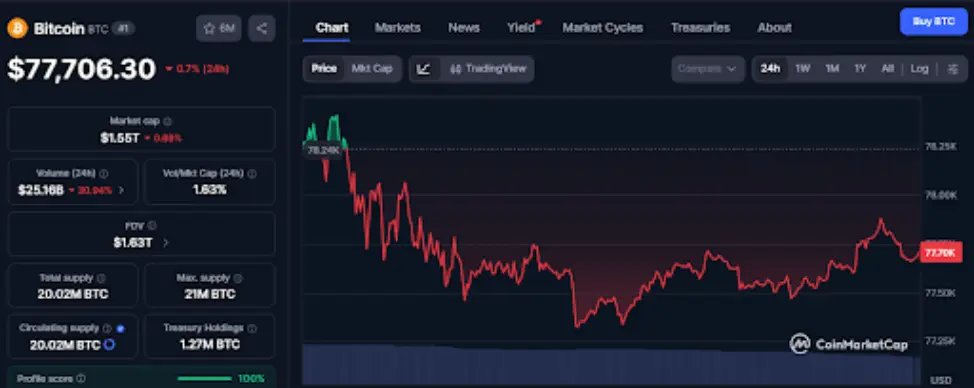
Bitcoin Price Falls 0.7% as 24-Hour Trend Stays Below Early Highs
A brief look at the time of press reveals that the Bitcoin price traded at $77,706.30 after falling 0.7% in 24 hours. The price trend showed early weakness after a brief move above the $78,250 region. Bitcoin price then dropped sharply and moved below the $78,000 level.
The Bitcoin price later moved into a lower range near the $77,500 level. Momentum weakened further before BTC reached its lowest area below the mid-range. After that decline, Bitcoin recovered and moved back toward $77,700. The rebound created a steadier structure, although the Bitcoin price stayed below earlier highs.
After that, Bitcoin price tried another recovery attempt, followed by a short pullback before settling at $77,706.30. Trading volume reached $25.16 billion, down 30.94% over 24 hours. Market cap stood at $1.55 trillion after falling 0.69% during the same period.
Bitcoin Sentiment Enters FOMO Zone as Price Nears $80K Resistance
According to Santiment data, Bitcoin sentiment moved from extreme pessimism to strong FOMO as the Bitcoin price recovered from the recent $80,000 rejection. The chart showed crowd fear after BTC failed near $80,000, with negative commentary rising sharply. That pessimistic phase came as Bitcoin appeared to risk deeper losses. However, the Bitcoin price recovered quickly and moved above $78,700, according to the shared data.
The recovery changed the sentiment picture across social media. Positive commentary increased, while the positive-to-negative ratio moved into the chart’s FOMO zone. The latest reading placed crowd sentiment in euphoric territory as BTC moved closer to $80,000 again. The observation labeled this area as “Crowd Greedy Above This Line,” marking a sharp mood shift.
Bitcoin’s price trend still showed a recovery pattern after the earlier rejection. The move above $78,700 kept the market near the next resistance zone. However, the chart tied strong optimism to a cautionary area. It showed that crowd FOMO rose while BTC approached the same level that rejected the price earlier.
Does the RVMM Indicator Support Bitcoin’s Push Toward $80K?
According to a technical analysis, Bitcoin price followed an upward progression trend from the lower April range toward the upper channel area. The price formed higher highs and higher lows inside a rising parallel channel. The Bitcoin price chart shows Bitcoin holding near the upper half of that channel after a steady recovery. The latest candles remain above the lower trendline, keeping the short-term structure positive.
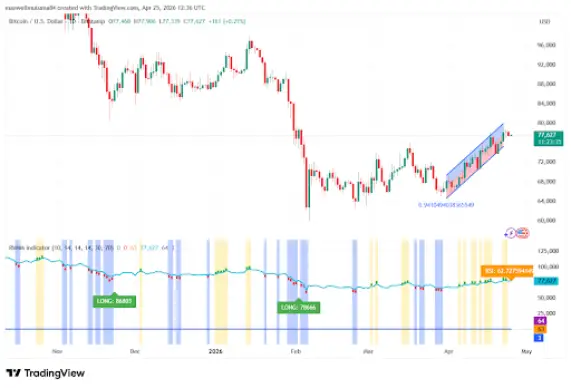
Earlier market action showed a wide decline from higher levels before Bitcoin’s price found support near the lower zone. After that base, Bitcoin recovered gradually and moved onto a cleaner upward path. The RVMM indicator supports the current recovery setup. Its RSI is at 62.72, which keeps the price action below the overbought level at 70. Recent yellow zones relates with the upward trend, while the earlier blue zones indicate weaker phases.
BTC-0.85% now faces pressure near the top of the rising regression channel. A breakout above that channel could open a move toward the next resistance area near $80,000. However, failure to hold the channel could trigger a pullback toward the lower trendline. For now, the setup keeps bulls in control while price holds its upward channel.
Credit: Source link