- The Chainlink price could lose $9 support and sellers attempt to complete the bear flag pattern amid geopolitical tension.
- The Chainlink reserve expanded its holdings with a fresh purchase of over 121,000 LINK.
- Derivative market data shows that the open interest tied to LINK futures contracts has plunged $400 million, suggesting a weak speculative force in price.
The Chainlink price dropped 1.95% during Thursday market hours to exchange hands at $8.89. This downtick followed a hawkish policy update from the U.S. Federal Reserve on March 18th and the escalating geopolitical tension in the middle east. However, the LINK price seeks support at $9 floor as Chainlink reserve completed another round of accumulation to bolster the asset’s long-term value. Can LINK hold the $9 floor?
LINK Faces Selling Pressure as Futures Market Cools Off
In the last three days, the Chainlink price plunged from $10 to $8.89 current trading value accounting for 11.37% drop. Consequently, the asset’s market cap dropped to $6.47 billion.
Along with price pullback, the derivative market trading also witnessed a notable slowdown. According to Coinglass data, the open interest associated with LINK’s futures contracts recorded a sharp dip to $459 to $400, projecting a 12% drop in the last 3 days.
The derivatives market for Chainlink’s native token (LINK) has seen less activity over the past few sessions, coinciding with downward pressure on its spot price. Data tracked by Coinglass indicates that open interest in LINK perpetual futures contracts has dropped from about $459 million to around $400 million, or about a 12% contraction over the past three days.
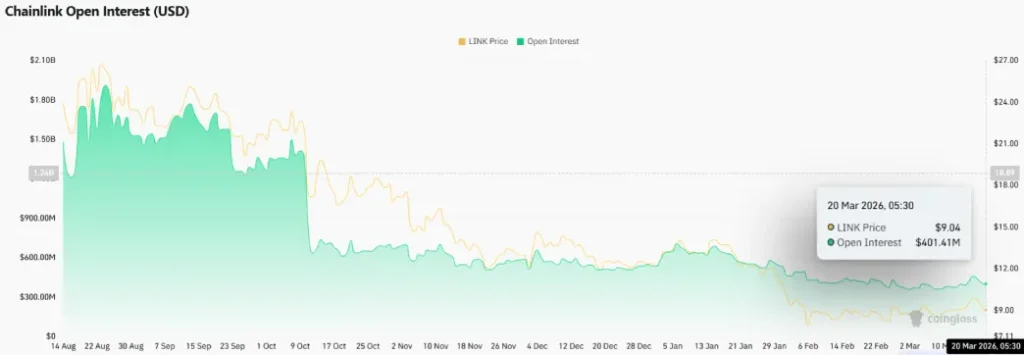
The initial drop in OI is likely triggered due to long liquidation of leverage traders amid the Federal Reserve decision to keep interest rates steady However, if the decline continues further it would suggest the traders are withdrawing from Link exposure cautious which also reduces the speculative force in price.
At the same time, the official Chainlink Reserve has kept up its steady token purchases. The latest addition saw 121,315.69 LINK, which is worth over $1.1 million at current market rates. This brings the aggregate reserves of this reserve to a total value of 2.66 million LINK tokens, amounting to $24.3 million in total estimated value. The average acquisition cost for the accumulated supply is worth $13.81 per token.
The reserve mechanism is based on transforming revenue streams (generated both from enterprise integrations of Chainlink’s oracle services off-chain and on-chain usage fees) into holdings of LINK. These periodic inflows are made to a transparent, on-chain transfer to a specified smart contract address, ensuring that the network development continues without external token sales or emissions.
Chainlink Price to Exit Month-long Recovery With this Breakdown
Over the past six weeks, the Chainlink price has witnessed a slow yet steady recovery within the two rising trendlines. This upswing followed a sharp decline in January 2026, signaling the formation of an inverted flag—a classic bearish continuation pattern.
The chart setup is commonly spotted in an established downtrend as it offers sellers a temporary breather to recoup its selling pressure.
If the pattern holds true, the sellers may flip the flag support to a potential resistance and drive an extended correction to $7.
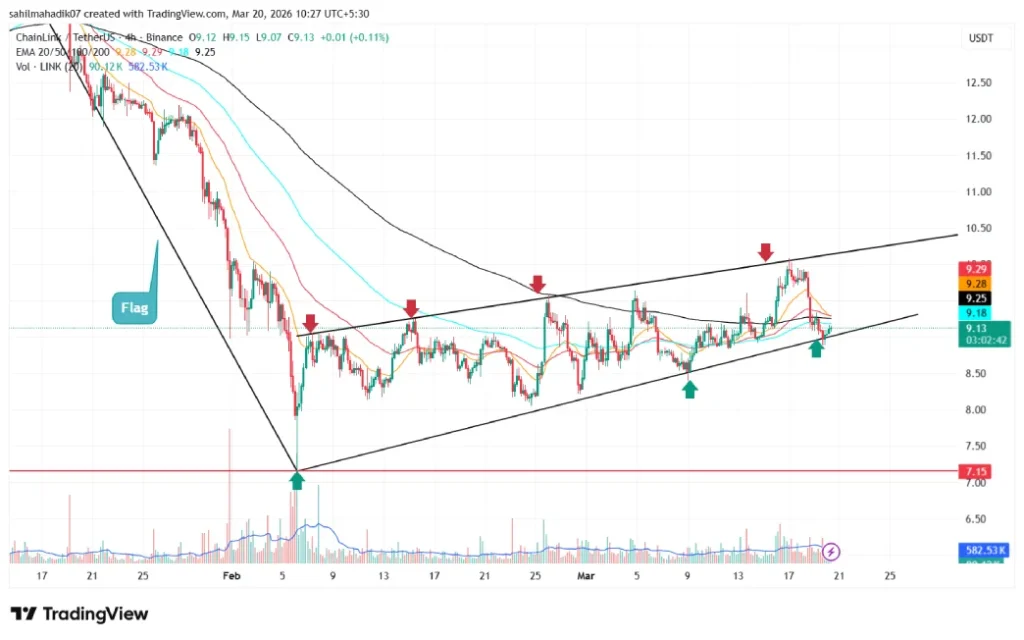
On the contrary, if the coin price managed to give a bullish breakout from flag resistance, the buyers could restore their grip over this asset and drive a sustainable recovery above the $10 ceiling.
Credit: Source link