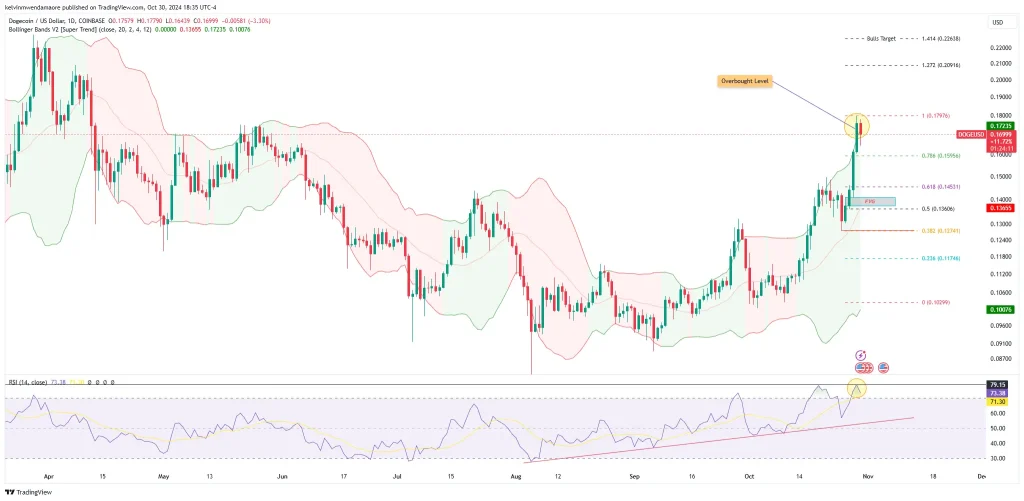
The dog-themed meme coin DOGE encountered resistance around $0.1797, a recent peak reached after Elon Musk’s endorsement at Donald Trump’s rally in New York. Since hitting this resistance level, the token has declined by 3.34% in the past 24 hours, bringing its market cap to $24.80 billion. Supporting this bearish outlook, daily chart technical indicators suggest a possible trend reversal as the cryptocurrency enters the overbought territory.
DOGE Technicals Hint at Correction
One such indicator is the Bollinger Bands, which indicate high price volatility as their bands continue to widen, with DOGE’s value near the upper band around $0.1725. This position places the token in an overbought area, increasing the likelihood of a correction. Should a pullback occur, potential support lies near the middle band at $0.1365, where the cryptocurrency could stabilize before a possible upward trend resumes.
The Relative Strength Index mirrors the Bollinger Band analysis, further supporting the overbought assessment. As observed on TradingView, the indicator peaked at 79.15 yesterday, marking an almost eight-month high since March 4. However, this RSI level has dropped to 73.38 today, cementing the possibility of a short-term market correction.
 However, despite these signals of a possible reversal, other indicators hint at continued bullish momentum. For instance, the Directional Movement Index (DMI) shows that bulls are currently dominant, with the +DI at 40.0231 higher than the -DI at 9.4867. This trend strength is further underscored by an ADX reading of 36.4551, suggesting the uptrend may persist in the near term, potentially leading to further gains before any correction materializes.
Large Holders Show Mixed Sentiment in DOGE: What’s Next?
As cited in a CryptoNewsZ analysis, Dogecoin is still experiencing massive shifts in large holders’ inflows and outflows, suggesting mixed market sentiment for cryptocurrency. As of press time, the inflows have surged, with a 7-day change of +75.19% and a 90-day rise of +435.16%, indicating that large DOGE token holders are likely accumulating or preparing for future trading activity.
This accumulation coincides with the meme coin hitting resistance around $0.1797, a potentially bullish sign if accumulation continues. On the other hand, outflows show an even steeper increase, with a 7-day rise of +510.14% and a 90-day change of +230.19%. This suggests that some large holders are taking profits at the current levels, adding selling pressure that could lead to a price correction.
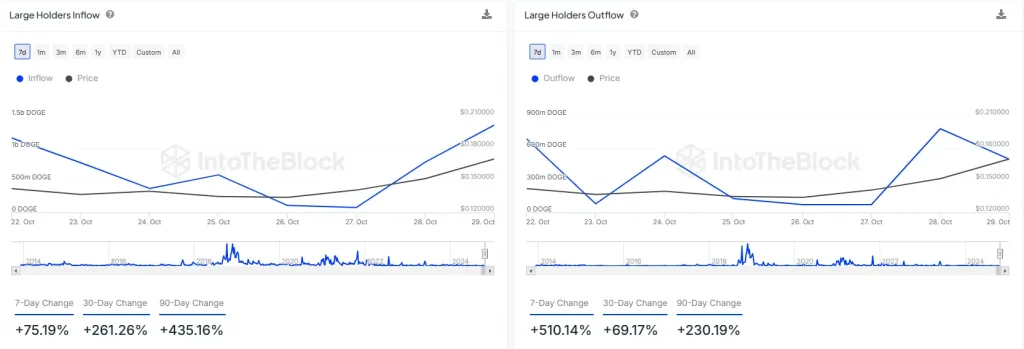
These contrasting trends in inflow and outflow support a cautious outlook. While some accumulation is evident, the significant outflow aligns with technical indicators, like overbought RSI and widening Bollinger Bands, which suggest a possible pullback.
Is a Pullback in Play?
Historically a formidable barrier, the $0.17 resistance level has repeatedly forced the token’s price to retreat upon contact, suggesting the meme coin may struggle to break through it. Moreover, with large holders’ outflows massively outweighing inflows, this imbalance hints at a potential price correction.
In such a scenario, key support levels lie around the fair value gap at $0.1595 and $0.1453, with further support at the Bollinger Bands middle arm at $0.1365. However, a break above $0.1797 could renew bullish momentum, targeting the $0.22 level in the near term, aligned with the 1.414 Fibonacci extension level.
Also Read: Polygon (MATIC) Price Hits $0.30 Key Support; Will the Downtrend Reverse?
Credit: Source link