
Close Menu
  • Home
  • Crypto News
  • Tech News
  • Gadgets
  • NFT’s
  • Luxury Goods
  • Gold News
  • Cat Videos
What's Hot

Aya Gold & Silver Hits High-Grade Silver at Zgounder Mine – News and Statistics

September 18, 2026

Tokenized stocks face 24/7 pricing gap: RedStone COO

September 18, 2026

Why Europe has been absent from the great AI safety debate | Technology

September 18, 2026
Facebook X (Twitter) Instagram
KittyBNK
Facebook X (Twitter) Instagram
Subscribe
  • Home
  • Crypto News
  • Tech News
  • Gadgets
  • NFT’s
  • Luxury Goods
  • Gold News
  • Cat Videos
KittyBNK
Home » ETC Price Analysis: Will ETC Price Bounce 20% To Reach $19?
Crypto News

ETC Price Analysis: Will ETC Price Bounce 20% To Reach $19?

September 8, 2023No Comments2 Mins Read
Facebook Twitter Pinterest LinkedIn Tumblr Email
ETC Price Analysis: Will ETC Price Bounce 20% To Reach ?
Share
Facebook Twitter LinkedIn Pinterest Email

ETC’s price has been on a downward spiral lately, losing about a quarter of its value in the past few months. This is just part of a larger trend, as the daily Ethereum price chart shows a steady decline.

This primary downtrend has given birth to a formidable resistance trend line, which, during the ongoing correction, has further solidified and produced a secondary resistance trendline.
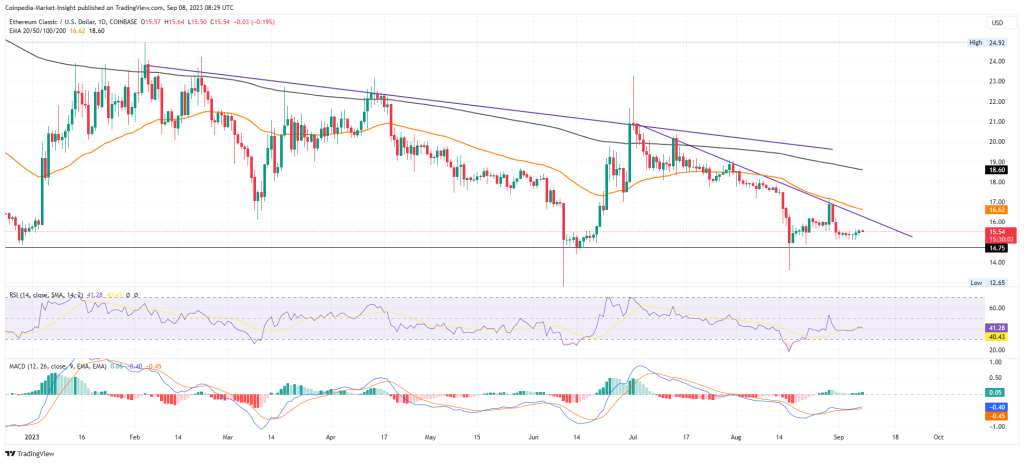
Diving deeper into the bottom supports, Ethereum Classic showcases persistent resilience at the $14.75 level. Notably, this support has proven to be a fortress, aiding Ethereum Classic to rebound almost five times. 

The ETC price action here evokes a potential double-bottom reversal, gearing up to challenge the secondary resistance trend line, coincidentally with the 50-day exponential moving average.

At the moment, Ethereum Classic is navigating at $15.53, registering a marginal intraday dip of 0.26%. A sudden revitalization in Bitcoin’s performance the previous night has sprinkled optimism on Ethereum Classic, hinting at a possible rounding reversal. 

Supporting this bullish narrative, the RSI indicator unveils a noteworthy bullish divergence accompanying the double-bottom formation. Moreover, the MACD indicator echoes this bullish divergence, cementing a positive relationship between the MACD and its signal line. 

If the ETC price breaks past this short-term resistance trend line, a bullish surge is on the cards, one that might knock on the doors of the primary resistance trend line near the $19 mark, marking an approximate rise of 22%.

Conversely, should the winds not favor Ethereum Classic and it plunges below the $14.75 threshold, we might witness a more profound bearish descent, potentially gravitating toward the earlier low of $12.65. This would translate to a roughly 13% depreciation from the current trading price.


Credit: Source link

Share. Facebook Twitter Pinterest LinkedIn Tumblr Email

Related Posts

Tokenized stocks face 24/7 pricing gap: RedStone COO

September 18, 2026

Bitcoin’s Loss-Making UTXO Plunge Signals a Potential End to the Bear Market — BigGo Finance

September 18, 2026

3 Luxury Cars You Can Buy on a Budget in 2026

September 18, 2026

Uniswap Price Eyes Bigger Rally As Robinhood Activity Surges

August 29, 2026
Add A Comment
Leave A Reply Cancel Reply

What's New Here!

Rossinavi Just Unveiled a New Marine Brand—With 5 New Aluminum Yachts

February 20, 2024

Uniswap Community Passed Two Proposals to Allocate $165.5M

March 20, 2025

Animoca Brands Japan Unveils NFT Launchpad ‘SORAH’

June 2, 2024

Memecoins Are Poised For 10,000%, CYBRO Presale Shatters $1.6 Million Milestone

August 15, 2024

Revolutionizing Charity in the Metaverse: Meta-Shelter TextTeo Unveils a Web3 Haven for Dog Lovers

October 16, 2023
Facebook X (Twitter) Instagram Telegram
  • Contact Us
  • Disclaimer
  • Privacy Policy
  • Terms of Use
  • DMCA
© 2026 kittybnk.com - All Rights Reserved!

Type above and press Enter to search. Press Esc to cancel.