- The Ethereum price correction gives a bearish breakdown below the support of inverted pendant pattern to bolster a prolonged downtrend.
- Ethereum accumulator addresses show a rare decline in their realized price trend.
- The downsloping slope of exponential moving averages (20, 50, 100, and 200) indication the path to least resistance is down,
ETH, the second largest cryptocurrency by market capitalization showed low volatility trading on Thursday, with its price wavering around $1,934. The daily chart displayed a neutral candle formation as Ethereum price reacted to the broader market uncertainty as Bitcoin drifted lower to $66,000. However, the top altcoin faces additional concern as its addresses recorded a notable downtick for the first time. Is a breakdown below $1,800 next?
ETH Accumulator Addresses Signal Strong Conviction Amid Market Weakness
Recent data on-chain for Ethereum reveals an interesting development among addresses considered as active accumulators. The realized price measure for this group (i.e., their volume-weighted average acquisition cost) has shifted from its long-term upward trend and points downward for the first time in the period tracked.
Two main explanations might be offered for such a shift: either holders of higher costs within the cohort had exited positions thus pulling the average low through disposal or new positions were set up at reduced price levels comparatively thus diluting the overall cost basis.
Cross-referencing with pertinent related indicators helps to elucidate the driver. In the period that the realized price fell, the total balance held by these addresses increased substantially, while their aggregate realized capitalization was steadily growing. This combination represents net inflows in lower entry points instead of net reductions from sales.
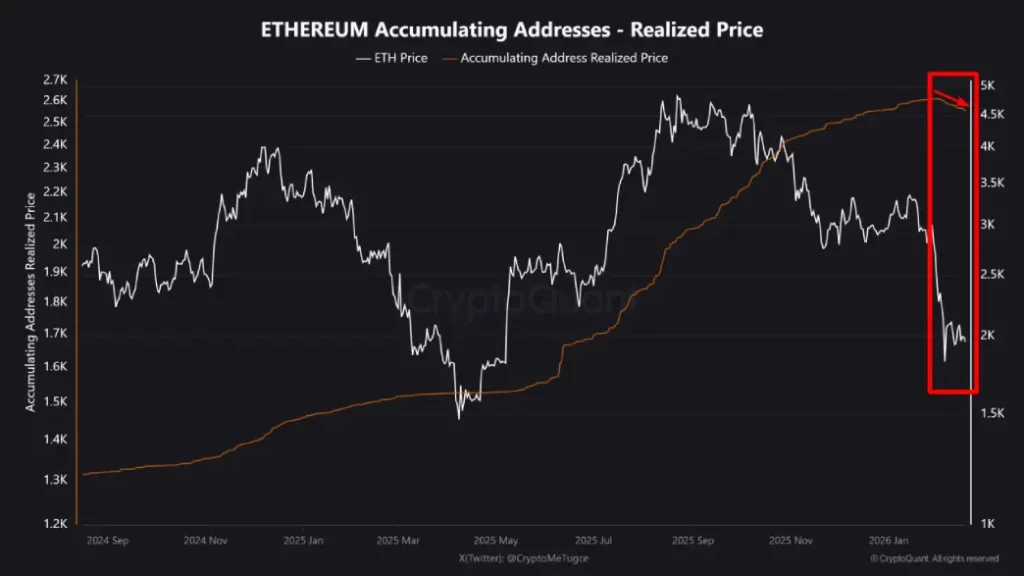
The behavior is consistent with persistent belief in these participants who appear to be increasing exposure in the face of general market weakness. Current ETH levels are below this cohort’s average cost basis, but inflows to it continue and have accelerated over recent periods.
Analyst CryptoMe highlights that this observation only discusses the accumulating whale cohort, and not the overall development around ETH. While whale accumulation bolsters potential for bullish reversal, several other indicators could drive the ETH’s price trajectory.
Ethereum Price Completes Bear Pennant Pattern to Chase $1,620 Support
Since last week, the Ethereum price witnessed a significant downturn from $2,106 to current trading value of $1,944, registering a 8.18%. This downswing gave a decisive breakdown below the lower boundary of the bear pennant pattern of the 4-hour chart.
The chart setup is characterized by a long descending slope indicating the prevailing downtrend in price, followed by short consolidation within two converging trendlines to offer price a temporary breather to recoup exhausted bearish momentum.
Following the recent breakdown, the ETH price is poised to extend the ongoing downtrend. The downsloping EMAs (20, 50, 100, and 200) of the 4-hour chart offer the extra headwinds against price and denote the broader bearish sentiment in the market.
With sustained selling, the Ethereum price could plummet 9.82% to reach $1,745 support, followed by a deeper dive to $1,620.
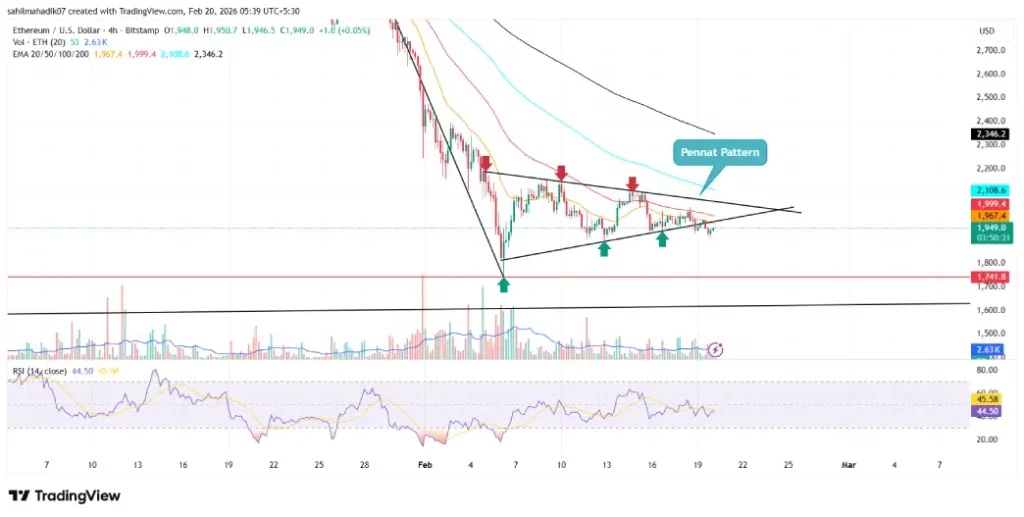
On the contrary, if coin sellers failed to sustain pennant pattern breakdown, the coin price could immediate reclaim the $2,000 mark.
Credit: Source link