The LINK price today hovered near $11.95 at the time of writing as its spot ETFs quietly absorbed supply. While institutional inflows remain steady and on-chain accumulation continues, the market response has been still muted, raising questions about whether Chainlink’s next move requires deeper price discounts before momentum returns.
LINK ETFs Quietly Absorb Circulating Supply
According to on-chain and ETF tracking data, spot LINK ETFs have already accumulated more than 1% of Chainlink’s total circulating supply, with a market cap of $8.42 billion. The 1% makes the Total net assets across the products approximately $85.34 million.
Notably, this absorption has come from just two sponsors, Grayscale and Bitwise, alone, highlighting the scale of capital concentration involved.
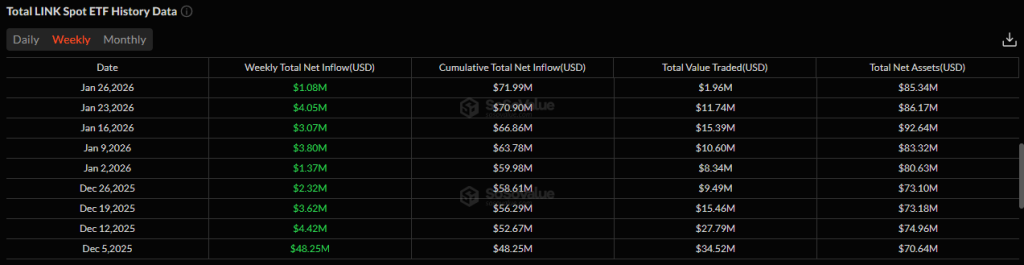
Meanwhile, ETF flow data shows no recorded weekly outflows since launch, suggesting sustained accumulation rather than speculative rotation. From a market structure perspective, this steady buying provides a longer-term demand base even as price action remains soft.
Strategic Reserves and On-Chain Accumulation Build
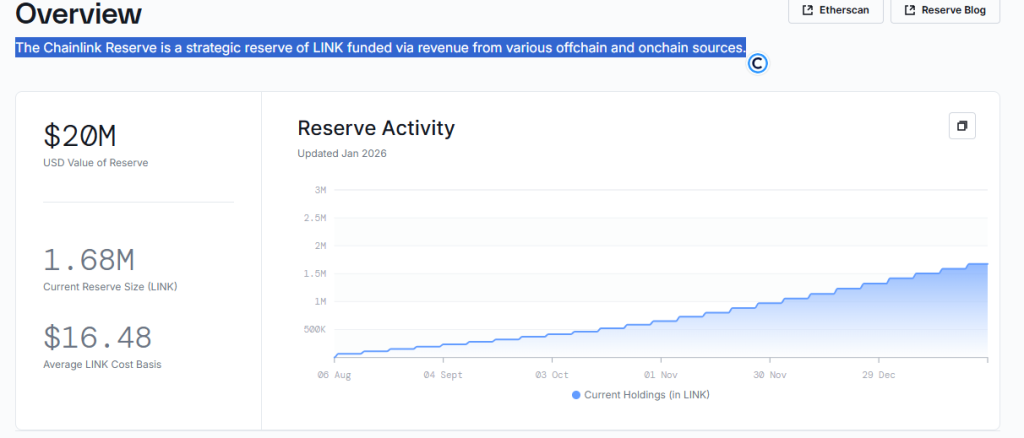
At the same time, Chainlink’s internal reserve holdings have continued to grow. The Chainlink Reserve which now holds roughly 1.68 million LINK tokens, funded through a mix of on-chain and off-chain revenue streams. This expansion reinforces the protocol’s long-term sustainability strategy.
Beyond treasury data, on-chain metrics add another layer. Exchange reserves and whale activity have both trended higher, signaling accumulation rather than distribution.
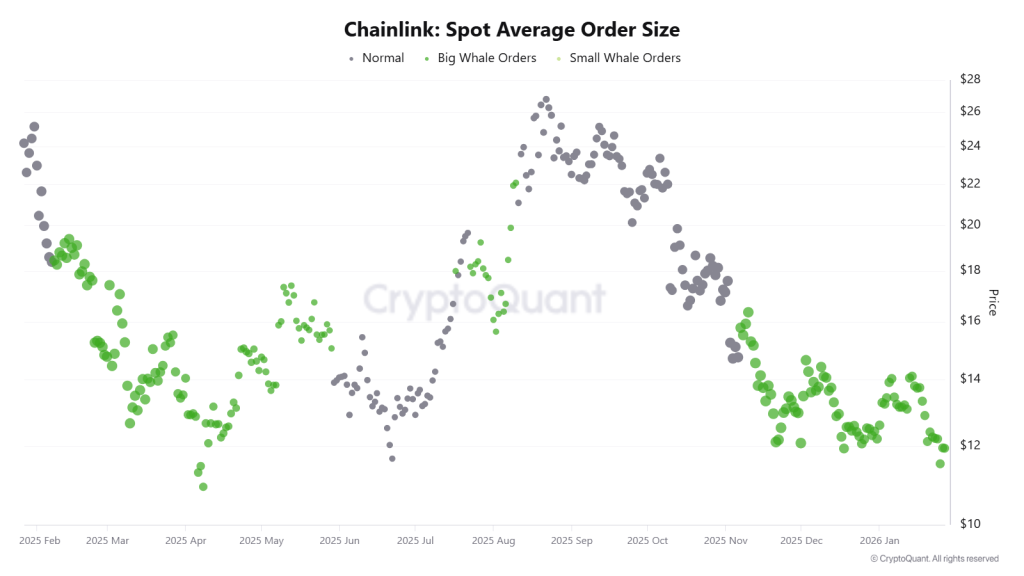
Collectively, these dynamics support a constructive long-term view for LINK crypto, even as short-term price weakness persists.
Why Institutions May Be Waiting for Lower LINK Price Levels
That said, institutional participation often comes with a preference for discounted entry points or simple they look for “dirt cheap prices”. Despite visible accumulation, price behavior suggests maybe institutional buyers are not yet satisfied.
Historically, large entities tend to scale positions during drawdowns rather than during strength, and the current LINK price chart appears to reflect that pattern.
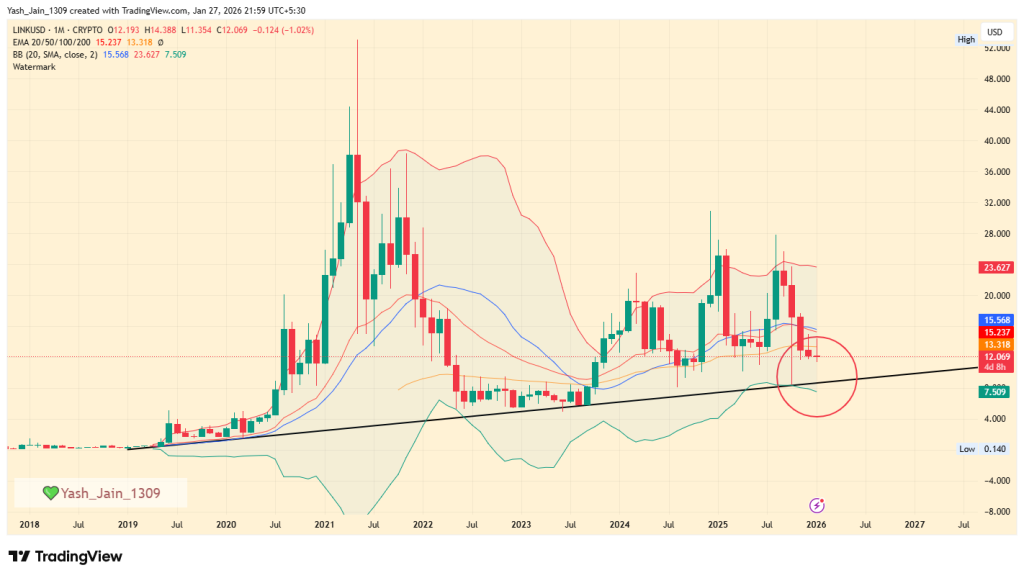
From a broader technical angle, LINK crypto’s monthly structure shows that major uptrends have typically started only after a decisive monthly closing candle on its long-term ascending trendline. That confirmation has not occurred since 2023. The current decline may therefore represent the type of drawdown institutions often seek before re-engaging more aggressively.
LINK Price Chart Signals Risk of Further Decline
From a technical perspective, several indicators continue to lean bearish. The monthly Bollinger Bands show room toward the lower band, while the MACD has printed a bearish cross. Meanwhile, the RSI slipping below 50 suggests weakening bullish momentum.
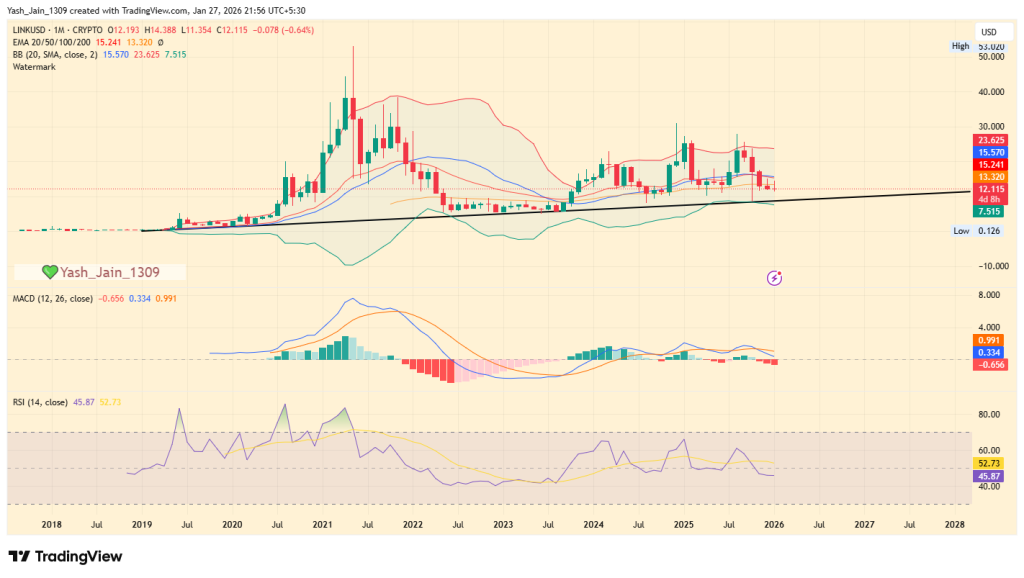
Technically, dynamic support aligns near the $8.75–$9.00 zone, roughly 25% below current levels. If price revisits this region, it would align with historical accumulation phases seen before prior multi-month recoveries. In that context, the current setup suggests the LINK price forecast narrative remains vulnerable in the near term, even as longer-term fundamentals remain intact.
Trust with CoinPedia:
CoinPedia has been delivering accurate and timely cryptocurrency and blockchain updates since 2017. All content is created by our expert panel of analysts and journalists, following strict Editorial Guidelines based on E-E-A-T (Experience, Expertise, Authoritativeness, Trustworthiness). Every article is fact-checked against reputable sources to ensure accuracy, transparency, and reliability. Our review policy guarantees unbiased evaluations when recommending exchanges, platforms, or tools. We strive to provide timely updates about everything crypto & blockchain, right from startups to industry majors.
Investment Disclaimer:
All opinions and insights shared represent the author’s own views on current market conditions. Please do your own research before making investment decisions. Neither the writer nor the publication assumes responsibility for your financial choices.
Sponsored and Advertisements:
Sponsored content and affiliate links may appear on our site. Advertisements are marked clearly, and our editorial content remains entirely independent from our ad partners.
Credit: Source link