Close Menu
  • Home
  • Crypto News
  • Tech News
  • Gadgets
  • NFT’s
  • Luxury Goods
  • Gold News
  • Cat Videos
What's Hot

XRP Rich List Update August 28th

August 28, 2026

Stripe-Led Group Is Reportedly Abandoning Its PayPal Acquisition

August 28, 2026

Overdramatic Cats Suddenly Realize They’re at the Vet 😂 Funny Cat Videos 2026

August 28, 2026
Facebook X (Twitter) Instagram
  • Contact Us
  • Disclaimer
  • Privacy Policy
  • Terms of Use
  • DMCA
Facebook X (Twitter) Instagram
KittyBNK
  • Home
  • Crypto News
  • Tech News
  • Gadgets
  • NFT’s
  • Luxury Goods
  • Gold News
  • Cat Videos
KittyBNK
Home » Massive Breakout on the Horizon? Watch This Key Pattern!
Crypto News

Massive Breakout on the Horizon? Watch This Key Pattern!

August 13, 2024No Comments2 Mins Read
Facebook Twitter Pinterest LinkedIn Tumblr Email
Massive Breakout on the Horizon? Watch This Key Pattern!
Share
Facebook Twitter LinkedIn Pinterest Email

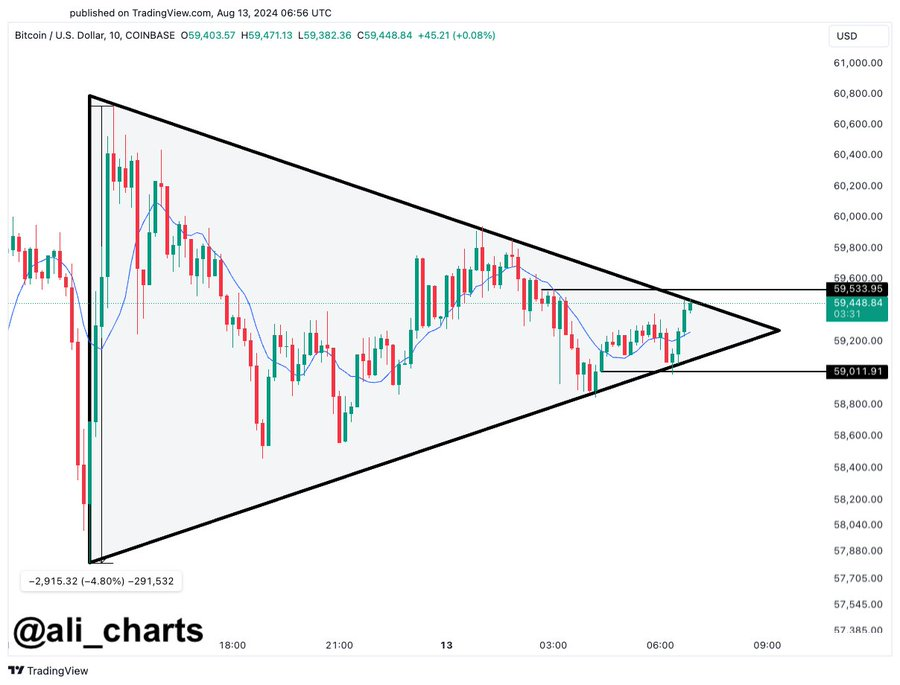
Bitcoin is currently displaying a symmetrical triangle pattern on lower time frames. What this indicates is a potential for a significant price move. At present, Bitcoin is trading at $58,981.14. But, recent data shows mixed signals for its short-term trajectory. 

Recent Bitcoin Price Trends 

Over the past seven days, Bitcoin has risen by 6.4%, including a modest 0.6% increase in the last 24 hours and a 0.2% rise in the past hour. However, these gains follow a sharp decline earlier in August 2024. 

Bitcoin Chart Analysis: Volatile Start in August 

Bitcoin began August at $65,276 but quickly experienced a steep drop, falling to $53,984 between August 2nd and 5th. This decline was followed by a brief surge on August 8th, when strong buying pressure pushed the price from $55,113 to $61,706 in a single day. Unfortunately, this momentum was short-lived, as Bitcoin fell back below the $60,000 mark by August 11th, where it has remained. 

Bitcoin 4-hour Chart Analysis: Symmetrical Triangle Pattern Emerges 
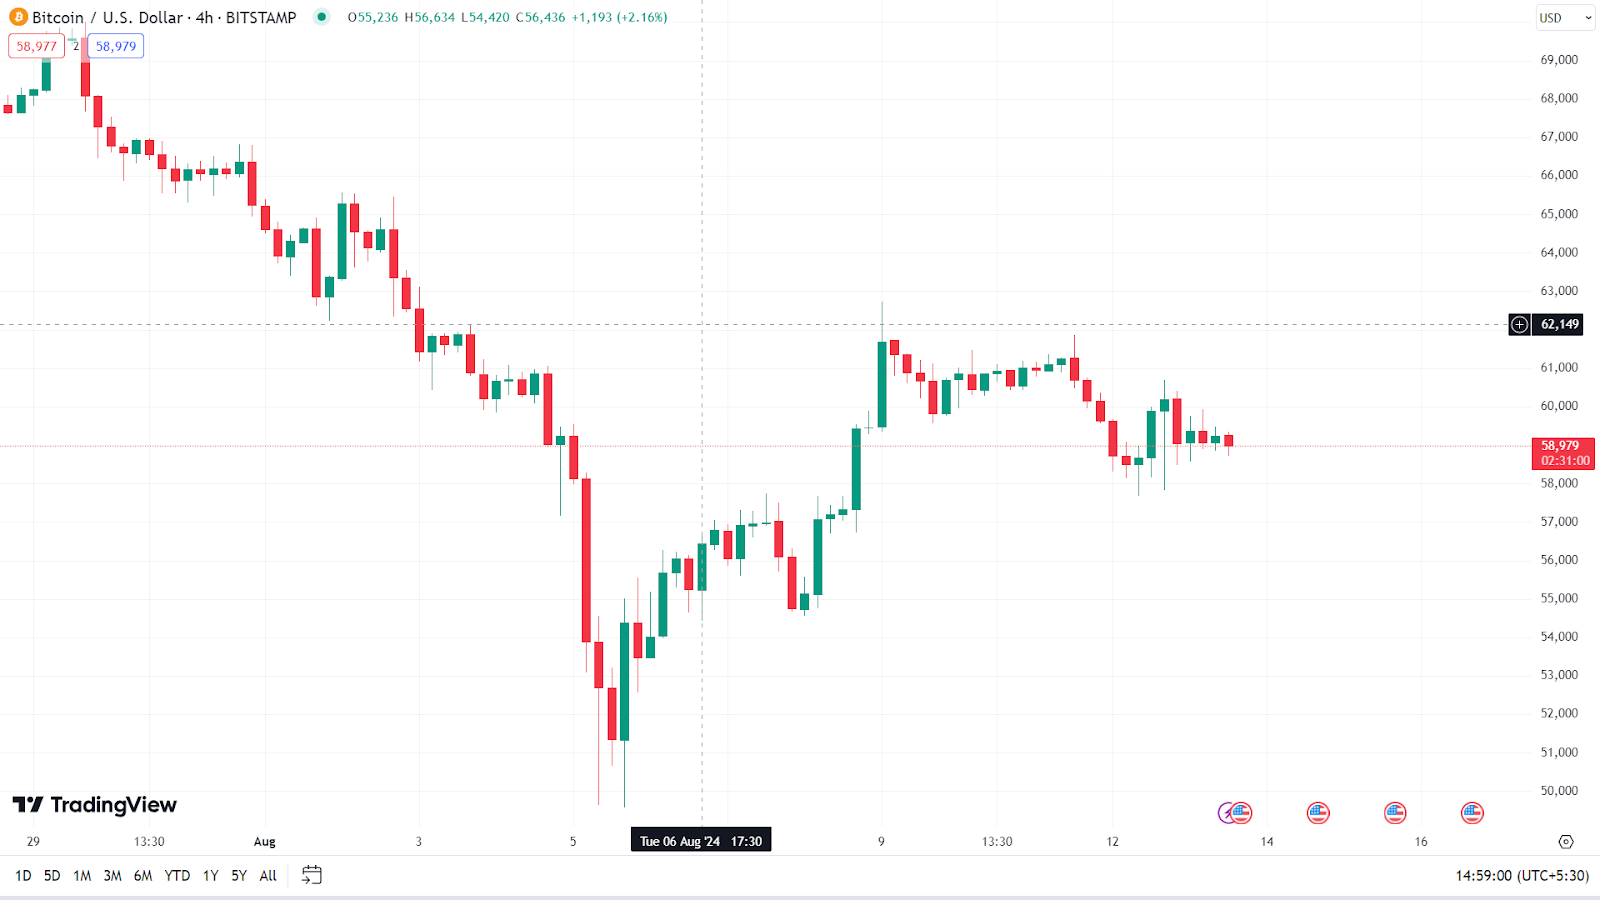
In the 4-hour Bitcoin chart, a symmetrical triangle pattern has formed, suggesting a potential breakout. The price dropped from $69,542 on July 29th to $51,365 by August 5th before buyers reentered the market, pushing the price up to $61,674 on August 9th. Since then, Bitcoin has been trading sideways, fluctuating between $61,710 and $58,505.
Massive Breakout on the Horizon? Watch This Key Pattern!

Bitcoin’s current symmetrical triangle pattern hints at a possible breakout. Traders should watch the $59,000 – $59,530 range closely, as a substantial close outside this range could trigger a significant price move, as per an expert identified as Ali Martinez in X. 

Also Read: Markets Could Remain Highly Volatile: Here are the Cryptos to Monitor This Week

Credit: Source link

Share. Facebook Twitter Pinterest LinkedIn Tumblr Email

Related Posts

XRP Rich List Update August 28th

August 28, 2026

XRP Price Today Slips to $1.42 as $20 Million in Long Positions Get Wiped Out

August 28, 2026

SOL Jumps 13% Amid Charles Schwab Trading Plans and Solana Deflationary Vote

August 27, 2026

Genius Group Plans $1.2B Plan for AI and Bitcoin Treasuries

August 27, 2026
Add A Comment
Leave A Reply Cancel Reply

What's New Here!

Sun International’s Lefika Villas are SA’s most luxurious timeshare 

October 27, 2023

cute cat being chased by watermelon #NekoAI.4rt #catshorts #catvideos #catlovers #funnycats

August 21, 2025

Xsolla Introduces Offerwall Solutions to Boost Game Monetization

March 5, 2025

Everything announced at Apple’s Let Loose iPad event

May 7, 2024

Hyundai INSTER Cross: UK Pricing and Specs

January 14, 2025
Facebook X (Twitter) Instagram Telegram
  • Contact Us
  • Disclaimer
  • Privacy Policy
  • Terms of Use
  • DMCA
© 2026 kittybnk.com - All Rights Reserved!

Type above and press Enter to search. Press Esc to cancel.