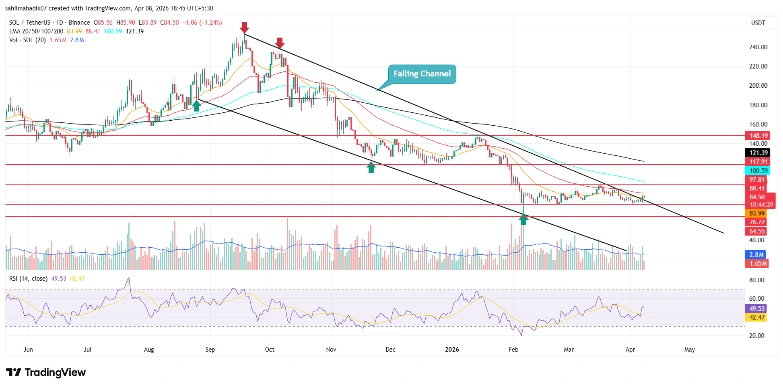
- The Solana price gives an upside breakout from the resistance trendline of a seven-month-long resistance trendline.
- A diplomatic breakthrough materialized as the U.S., Iran, and Israel reached a conditional two-week ceasefire agreement, easing immediate geopolitical tensions.
- The momentum indicator RSI (Relative Strength Index) at 49% indicates a neutral sentiment among market participants.
SOL, the seventh largest cryptocurrency by market capitalization, shows a slight downtick of 1.1% ahead of U.S. market hours on Wednesday. This pullback came as the crypto market stabilized after a sudden spike yesterday following the US-Iran ceasefire announcement. However, the Solana price managed a decisive breakout from a multi-month downtrend, awaiting market participants’ response to drive a sustainable recovery.
Crypto Jumps as US-Iran-Israel Announces a 2-week Ceasefire
On April 7, the crypto market experienced strong inflows, pushing its total market capitalization to $2.44 trillion. Bitcoin regained its footing at $72,000, Ethereum stormed over $2,250, and Solana recorded good gains with other altcoins. The primary catalyst was a dramatic turnaround in investor sentiment following de-escalation in U.S.-Iran geopolitical tensions.
Markets had been nervous earlier on Tuesday morning as Iran at first rejected a proposal of ceasefire and President Donald Trump had given a stern ultimatum, demanding that the Strait of Hormuz be reopened immediately. Trump had already threatened to strike Iranian power plants, bridges and infrastructure severely, threatening Iran that “a whole civilization will cease to exist tonight” if the critical waterway remained blocked. The Strait of Hormuz, where about 20 percent of the world oil trade passes, was substantially shut down during the conflict, pushing oil prices soaring and causing concerns of long-term global energy disruption.
But there was no escalation. In its place, the U.S., Israel and Iran declared a conditional two weeks ceasefire, which also involved the temporary opening of the Strait of Hormuz. This breakthrough eased immediate supply concerns, triggering a sharp plunge in oil prices below $95–$100 per barrel.
The decline in geopolitical risk increased risk appetite in the global markets and investors began to pour money into cryptocurrencies as they began to abandon the safe-haven assets in favor of growth-oriented assets. Although optimistic, analysts warn that the truce is only temporary and volatility is still high.
Solana Price Gives a Major Breakout From Multi-Month Channel Pattern
In the last 24-hours, the Solana price surged from $80 to $84.6, registering a gain of roughly 6%. The uptick gave a high-volume bullish breakout from the resistance trendline of a falling channel pattern in the daily chart.
Since mid-September 2025, the two downsloping trendlines of the channel pattern acted as the major resistance and support levels amid the market correction. Therefore, the recent breakout and a surge above the 20-day exponential moving average (EMA) signal an initial change in market trend. With today’s downturn, the Solana price could retest the breached trendline as potential support and validate its sustainability for further growth.
The post-breakout rally could push the asset 16.5% up to challenge the psychological resistance of $100, followed by a leap towards $118.
On the contrary, if price reenters the channel pattern with bearish breakdown, the sellers could strengthen their grip over the asset and drag the asset value below $80.
Credit: Source link