- The Solana price managed to exit month-long consolidation after a $91.5 resistance breakout, signaling renewed recovery momentum in the market.
- Market analysts point to Glassnode URPD data, revealing a dense concentration of trading activity in the $82–$85 range.
- The overhead 100-and-200-day EMAs ( exponential moving average) create additional selling pressure at $110 and $130.
Solana, the seventh largest cryptocurrency by market capitalization, shows a slight downtick of 0.8% to stabilize above $95.38 mark. However, a shallow pullback and daily candle showcasing long-rejection from bottom indicate underlying demand, and investors cautious behaviour as they wait for the Federal Reserve’s policy decision. However, the recent on-chain data shows that Solana price has a higher potential to extend its recovery above $100.
SOL Builds Strong Floor Near $85 as Bulls Target Higher Levels
Over the past week, the Solana price recorded a notable recovery from $80.26 to $95 registering 18% growth. Consequently, the asset’s market cap surged to $54.28 billion. The bullish momentum following broader market recovery amid the easing geopolitical tension.
Recent on-chain metrics for Solana show that some 76 million SOL tokens changed hands in the narrow band between $82.60 and $85.50 over the span of 38 days. This prolonged period of concentrated trading seems to have used up available sell orders in that zone, and a solid base of support was left behind as buyers stepped in heavily.
Glassnode’s Unspent Realized Price Distribution (URPD) visualization highlights this volatility at the highest volume bars are all concentrated around the bottom prices near $82.60 and $85.55, being distributed far along the horizontal scale up to the 25 hour mark equivalent, while the profile noticeably thins higher up. There is a brief, shallow bar around $94.40 indicating sparse previous accumulation there.
Above the present levels, token holdings are still relatively light. The closest meaningful supply pocket is near the round $100 figure with a further significant cluster around $115.04. This asymmetry implies that overhead resistance is lighter relative to the depth setup below which could open the door for upside price exploration provided momentum remains.
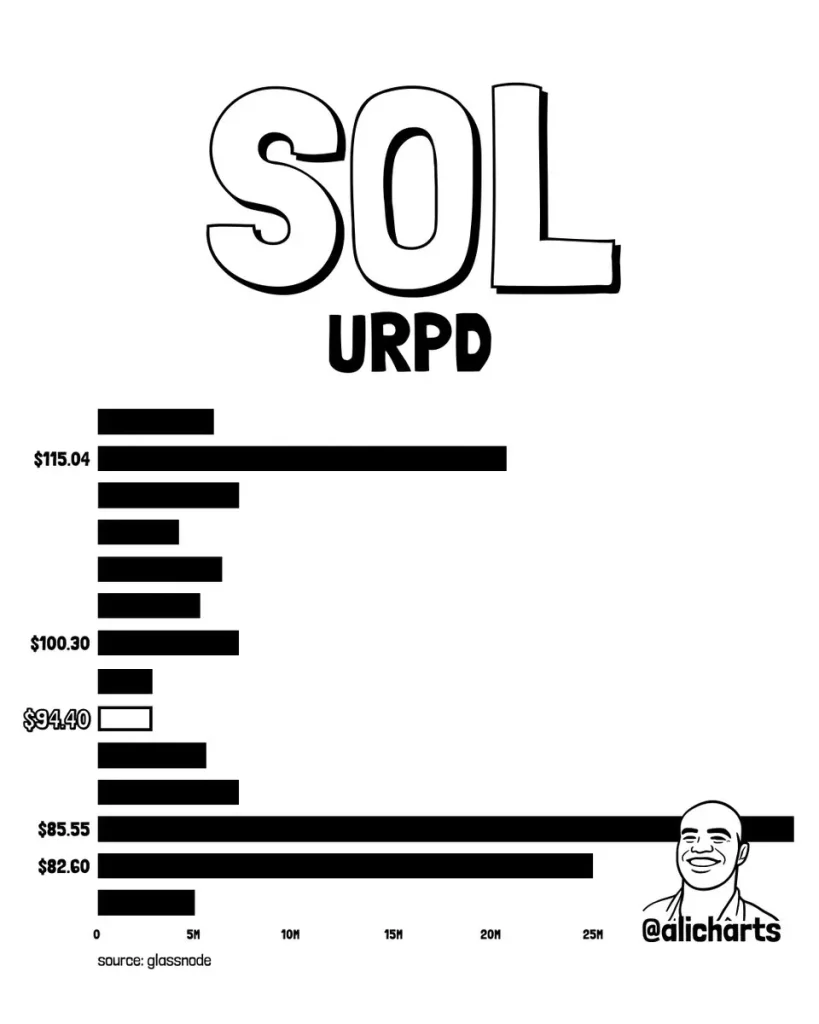
The observed structure serves to emphasize the way prior buying interest has fixed the lower boundary and left the path towards psychological and liquidity thresholds relatively unobstructed.
Solana Price Poised For Key Breakout From $91.5 Resistance
Amid the recent market recovery, the Solana price gave a decisive breakout from the resistance trendline of a falling channel pattern at $91.5. Since mid-September 2025, the coin price witnessed a steady downtrend, resonating within the two parallel trendlines of this pattern.
Historically, the chart setup has acted as a major reversal signal for market participants as breakout from its key resistance signals a shift in market sentiment. The daily chart shows that Solana price reclaimed the 20-and-50-day EMAs in its recent swing, signaling the recovery’s bullish momentum.
A 0.8% intraday loss today is likely retesting the breach trendline as potential support and validate the demand pressure for higher recovery. From the technical point of view, the post-breakout rally could push the asset $118 region for the initial target.
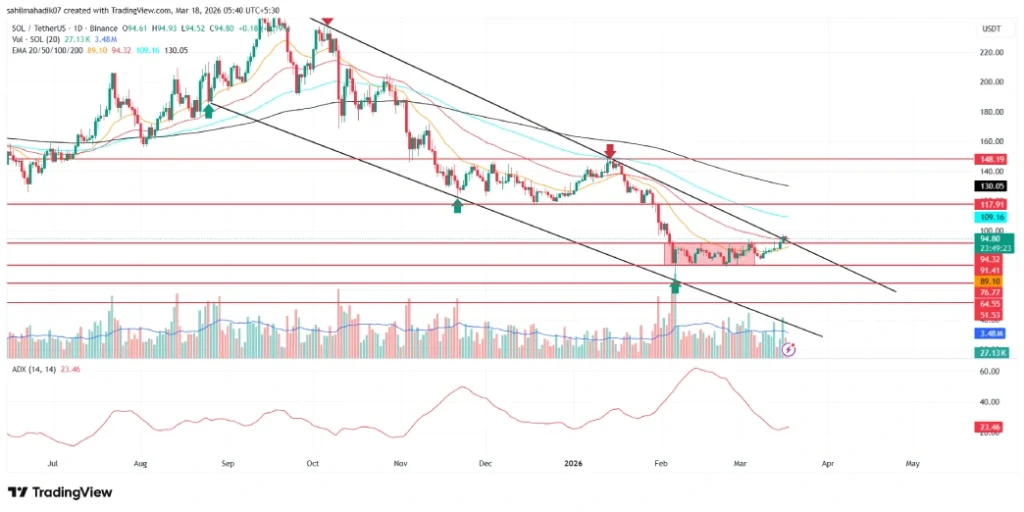
On the contrary, if the sellers continue to defend the pattern’s resistance trendline, the market participant must watch for reversal signals in a shorter time frame. A possible bearish reversal from this resistance would drive an extended downtrend in SOL price.
Credit: Source link