Bitcoin surged near $66,000 on Wednesday, leading the rise in cryptocurrency prices. This increase followed the April CPI report, which indicated a moderation in core inflation and a greater-than-expected cooling in retail sales. As BTC price is now gaining confidence, several altcoins are preparing for a skyrocketing trend this week, potentially challenging their previous ATH.
BTC Market Prepares For A Pullback
Bitcoin’s price has stabilized slightly above the crucial support level of $66,000, with crypto traders confident in its strength. However, some traders are concerned about the likelihood of a significant correction in the coming days due to a potential selloff around resistance channels.
Also read: Top Crypto Events to Watch Next Week: Binance vs. Nigeria, Decision on Ethereum ETF, and Crypto Bill
This could lead to a significant increase in interest in the altcoin market this week, potentially pushing several altcoins to new highs.
Pepe Price Analysis
Pepe’s price is experiencing increased bearish pressure following a selloff at the recent all-time high of $0.00001156. The price is falling below the EMA20 trend line, signaling a potential trend change. As of now, Pepe trades at $0.000009432, reflecting a decline of over 6.4% in the last 24 hours.
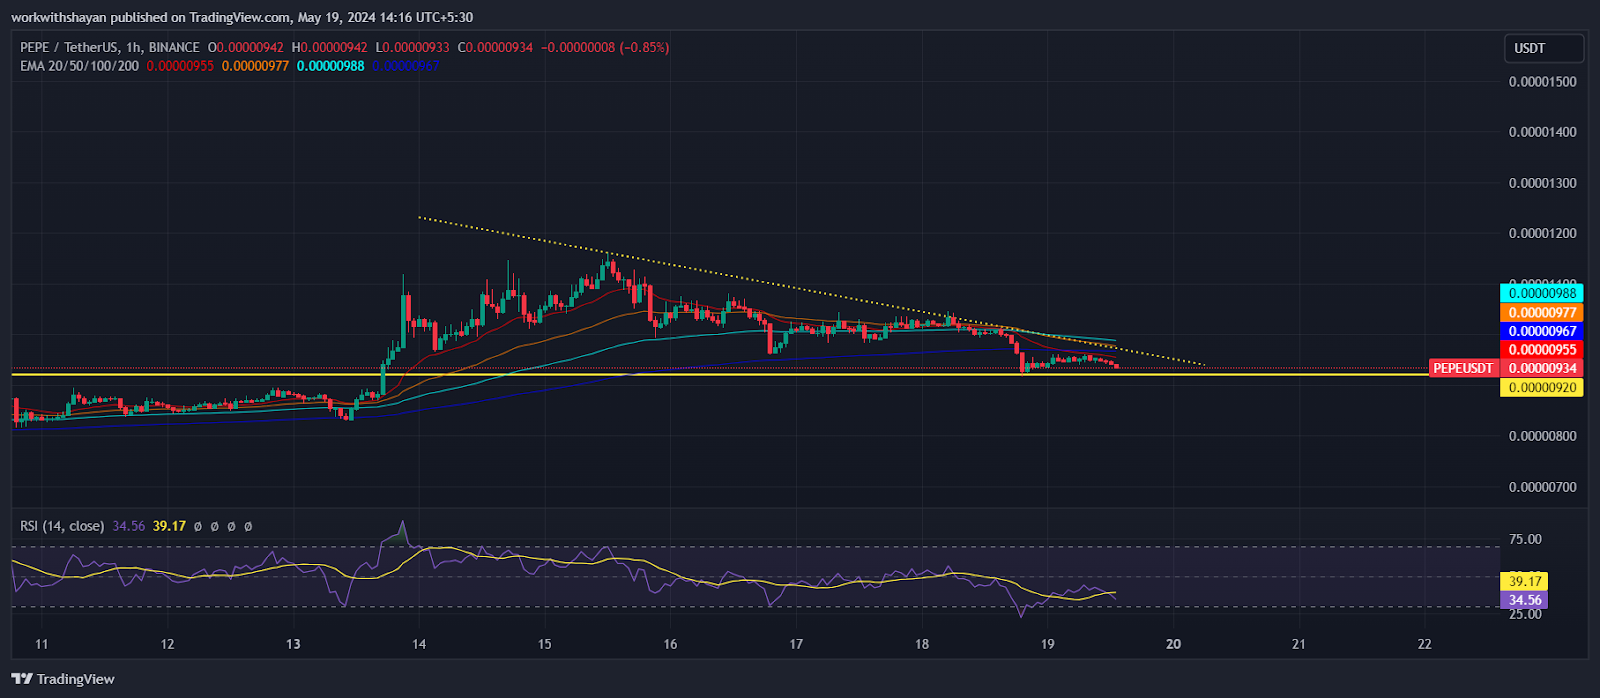
Buyers are trying to keep the price above the 20-day EMA ($0.00000958). If they succeed, the PEPE/USDT pair might climb back to $0.000011. This level is critical for the bears to defend because a rally beyond it could lead to an increase toward the ATH.
On the other hand, a break and close below the $0.0000091 support level would confirm a bearish pattern, potentially pushing the pair down to the strong support at $0.0000055. With the RSI sharply declining below the midline, bears currently have an advantage in dominating the price chart.
Render Price Analysis
Bulls are struggling to keep RNDR price above the 20-day EMA, currently at $10.2, indicating ongoing pressure from bears. However, Render price continues to hold its buying demand above Fib levels. As of writing, RNDR price trades at $10.6, surging over 5.4% in the last 24 hours.
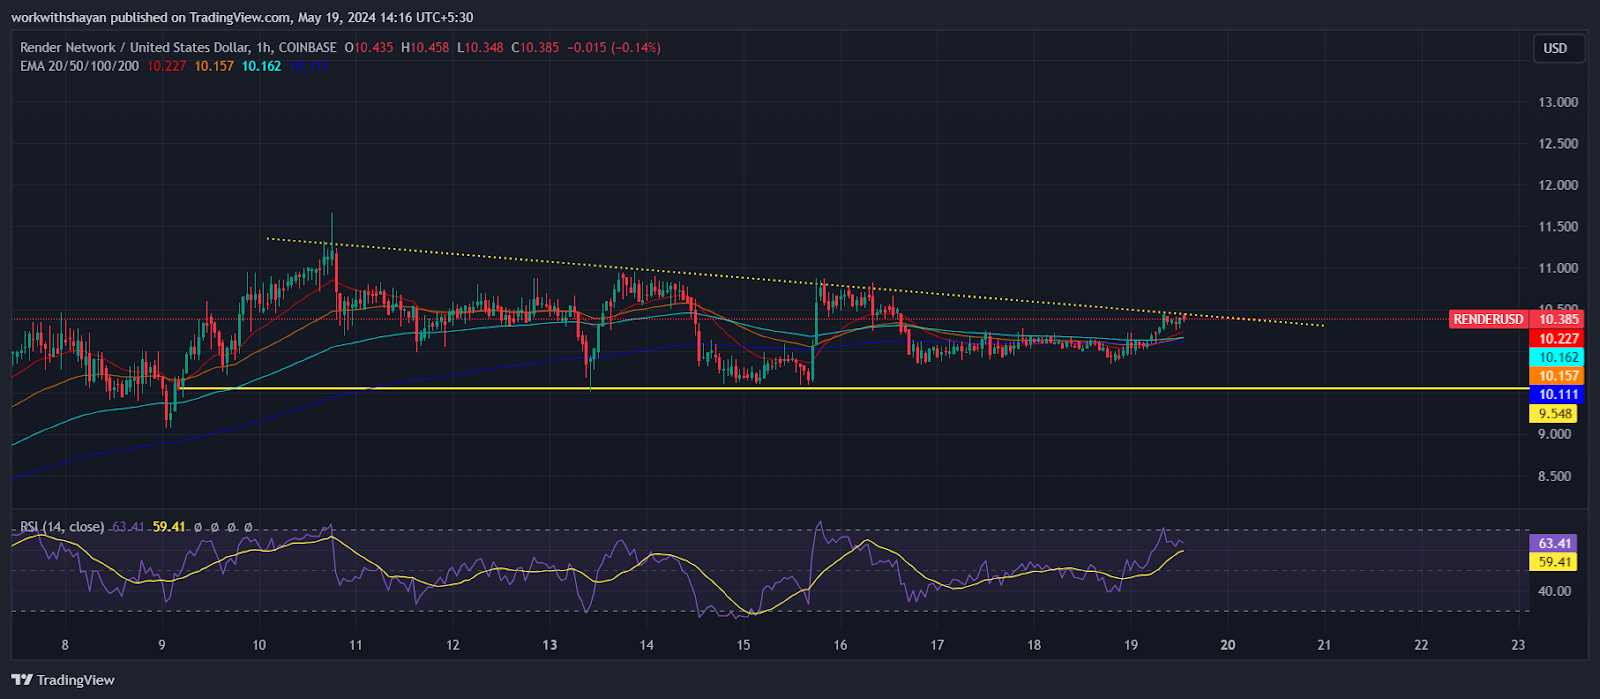
The 20-day EMA is surging, and the RSI is heading toward the overbought region, suggesting that RNDR might experience bullish movement for several more days. If buyers manage to sustain the price above the descending resistance line, the RNDR/USDT pair could potentially move towards the 50-day SMA at $11.4. This level may pose significant resistance, but surpassing it could send the price toward new ATH this week.
Conversely, a reversal from the 50-day SMA would indicate that bears dominate higher price levels. As a result, the pair might decline towards a crucial support level of $9.5.
Bonk Price Analysis
Bonk price has seen a significant increase recently, potentially testing the patience of buyers. Despite this surge, bears maintain a strong presence around the $0.000028 mark. Currently, Bonk price trades at $0.000028, marking an over 12.5% rise in the last 24 hours.
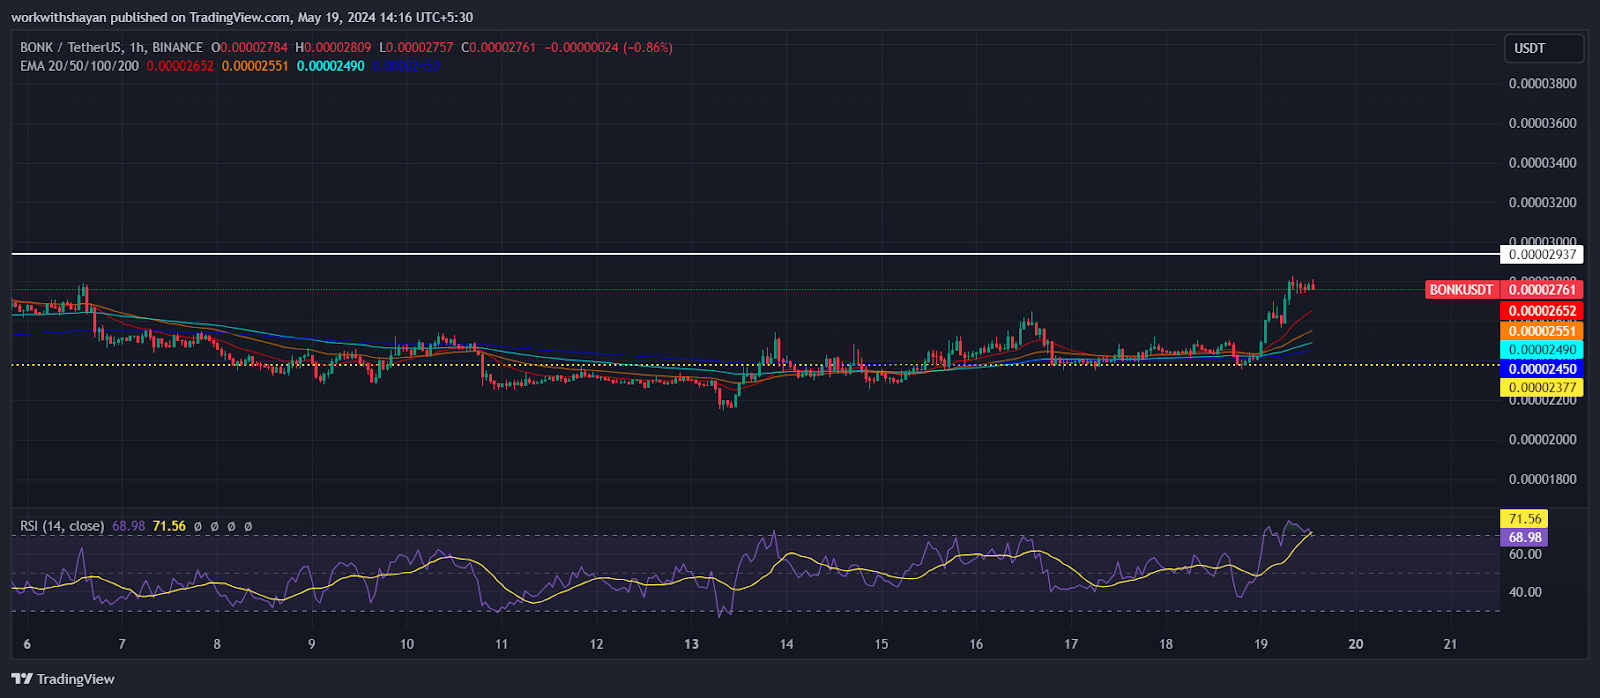
Buyers are working to hold the price above the 20-day Exponential Moving Average (EMA) of $0.0000265. If successful, the BONK/USDT pair could advance towards the 50-day Simple Moving Average (SMA). This level is critical for bears to defend, as surpassing it might lead to a rise towards a new ATH of $0.00005.
On the other hand, if the price declines and stabilizes below $0.0000237, it would indicate a bearish trend. This could result in the pair falling to the strong support level of $0.00002.
Credit: Source link