- The Solana price faces renewed selling pressure at the resistance trendline of a falling channel pattern in the daily charts.
- An inverted flag pattern on the 4-hour chart drives the ongoing recovery in SOL.
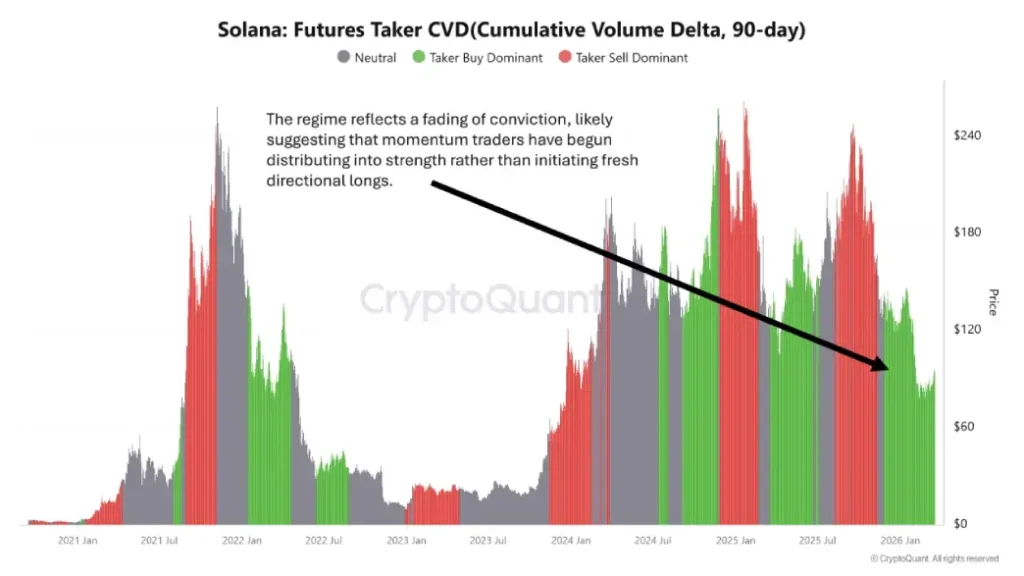
- Solana’s 90-day taker cumulative volume delta shows a clear transition from balanced aggression to dominant sell-side activity
On Thursday, the Solana price plunged roughly 1.5% during U.S. market hours to its current trade at $88.7. This downtick came as a follow-up to yesterday’s sell-off, primarily due to a hawkish stance from the U.S. Federal Reserve and surging oil prices. Amid the broader market correction, the leverage traders are using occasional relief rallies for distribution while the big pocket investors— whales are building their position, suggesting a late-cycle behaviour. Will SOL coin rebound for a $100 breakout?
SOL’s Derivative Weakness Meets Spot Accumulation
Solana’s perpetual futures contracts show a change in trader behaviour in early 2026, with momentum participants offloading holdings on rallies rather than going on the offensive and opening new long positions. The 90-day taker cumulative volume delta has moved away from the alternating aggressive buying and selling seen through much of 2024 and into 2025, now showing the characteristics of late-stage exhaustion in leveraged markets.
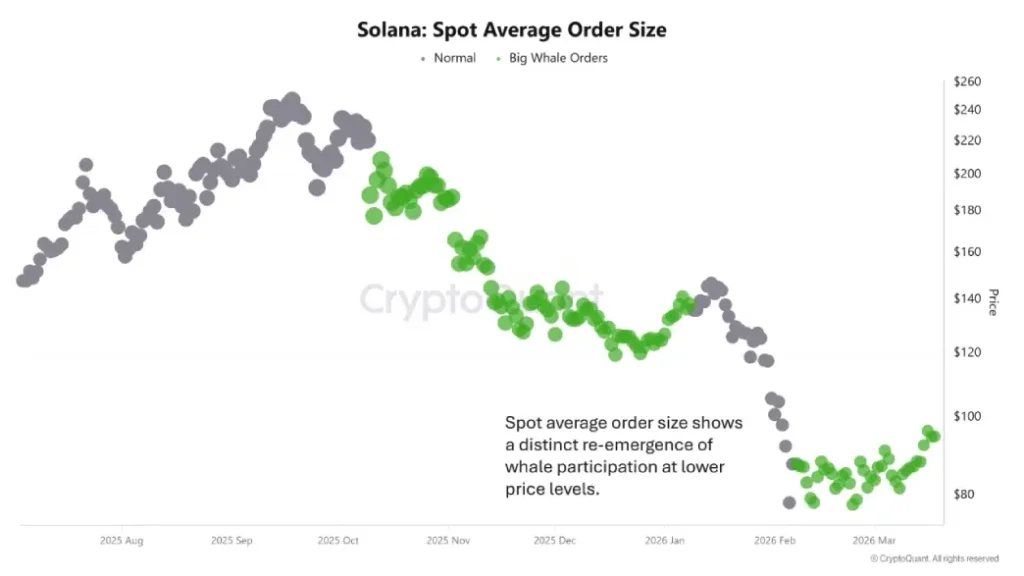
On spot exchanges, however, larger participants seem active again at depressed levels. After a lengthy trend of declining average order sizes during the lingering downtrend from late 2025 peaks, recent data indicates a visible rise in sizable clusters of trade around existing levels of support. This indicates the accumulation by important holders at times of weakness, in contrast to previous tendencies to seek upward momentum.
The resultant split in the market signals – distribution pressure in derivatives, and selective buying interest on-chain – coincides with Solana trading around the $88-$90 range as of mid-March 2026, after trading between approximately $86 and $97 in the preceding sessions.
Network fundamentals continue to be supportive with continued growth in developer contributions, uptime of the protocol, and increasing engagement across DeFi protocols and consumer-facing applications, helping to keep the conviction in baseline despite the token’s consistent altcoin-style price swings.
Here’s Why Solana Price Stands At A Make-or-Break Point
In the last 72-hours, the Solana price has reverted from $97.68 to $89, projecting a 8.8%. While many may see it as a general market pullback amid geopolitical tension, long liquidation, the technical chart highlights some key characteristics for a potential move.
The daily chart analysis shows that this pullback occurred precisely at the converging point of two resistances from the falling channel pattern and an inverted flag pattern, as shown in the chart.
Over the past six months, the Solana price has been resonating within two parallel-trendlines of a falling channel pattern, driving the mid-term correction. However, the latest upswing within the pattern, fluctuating within two converging trendlines, revealed the formation of a classic bear pattern called an inverted flag.
As the Solana price reversed from the channel pattern resistance, the sellers are aiming for a bearish breakdown from the flag support at $86. Based on the Solana price forecast, a bearish breakdown from the flag support will accelerate the selling pressure and drive the next bear cycle within the channel structure to the $76 floor.
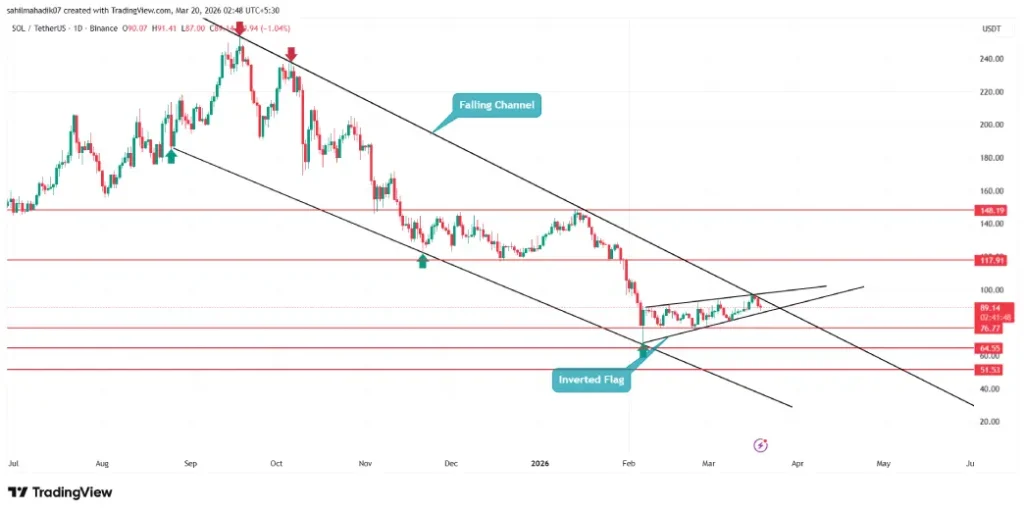
On the contrary, a strong bullish breakout from the channel resistance will invalidate the bullish thesis, and bolster Solana price for sustained rally above $100.
Credit: Source link