The cryptocurrency market has displayed a weak price action since the month started, indicating an increase in the selling pressure within the crypto space. Moreover, the global crypto market capitalization has recorded a drop of 10.27% in valuation, from $2.53 Trillion on 1st June to $2.27 on 30th June.
Furthermore, the elite cryptocurrencies continue hovering close to their crucial support levels, highlighting increased bearish sentiment in the crypto market.
With the rising volatility in the cryptocurrency market, will the top three tokens record a bullish reversal this July or plunge toward their new lows? Dive in as, in this article, we have covered the price analysis and targets of Bitcoin, Ethereum, and XRP for the upcoming week.
BTC Price Forms A Channel Pattern:
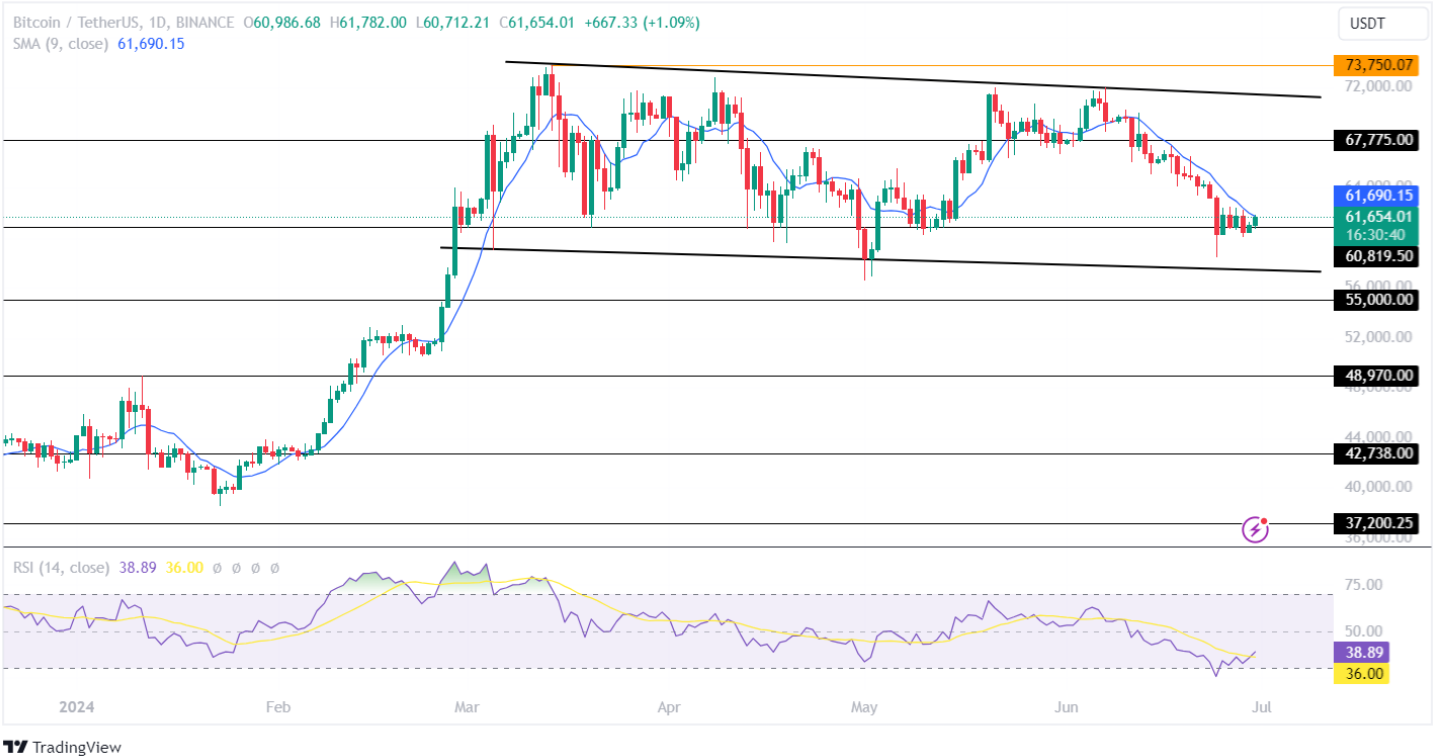
The Bitcoin (BTC) price has formed a parallel channel pattern in the 1D time frame, suggesting a weak price action for the star crypto in the market. Furthermore, the BTC price is hovering close to its crucial support level of $60,819.50, the outcome of which is unpredictable.
The Simple Moving Average (SMA) is on the verge of recording a bullish crossover in its price chart. This highlights an increase in the buying-over-selling pressure and a high possibility of a bullish reversal for the Bitcoin price in the cryptocurrency space.
On the other hand, the technical indicator, RSI has successfully retested its oversold range. This resulted in the BTC token experiencing a positive convergence.
If the market holds the Bitcoin crypto price above its crucial support level of $6,819.50, the bulls will head toward its resistance level of $67,775. Conversely, if the bears continue to dominate the market, the BTC price will plunge toward its lower support trendline.
ETH Coin Price Displays Increased Bearish Action:
Amid ongoing cross-border market correction, the Ethereum price has formed a descending channel pattern and has been trading within it since the start of June. Moreover, the altcoin leader has lost 3.37% within the past seven days and 9.40% over the past 30 days.
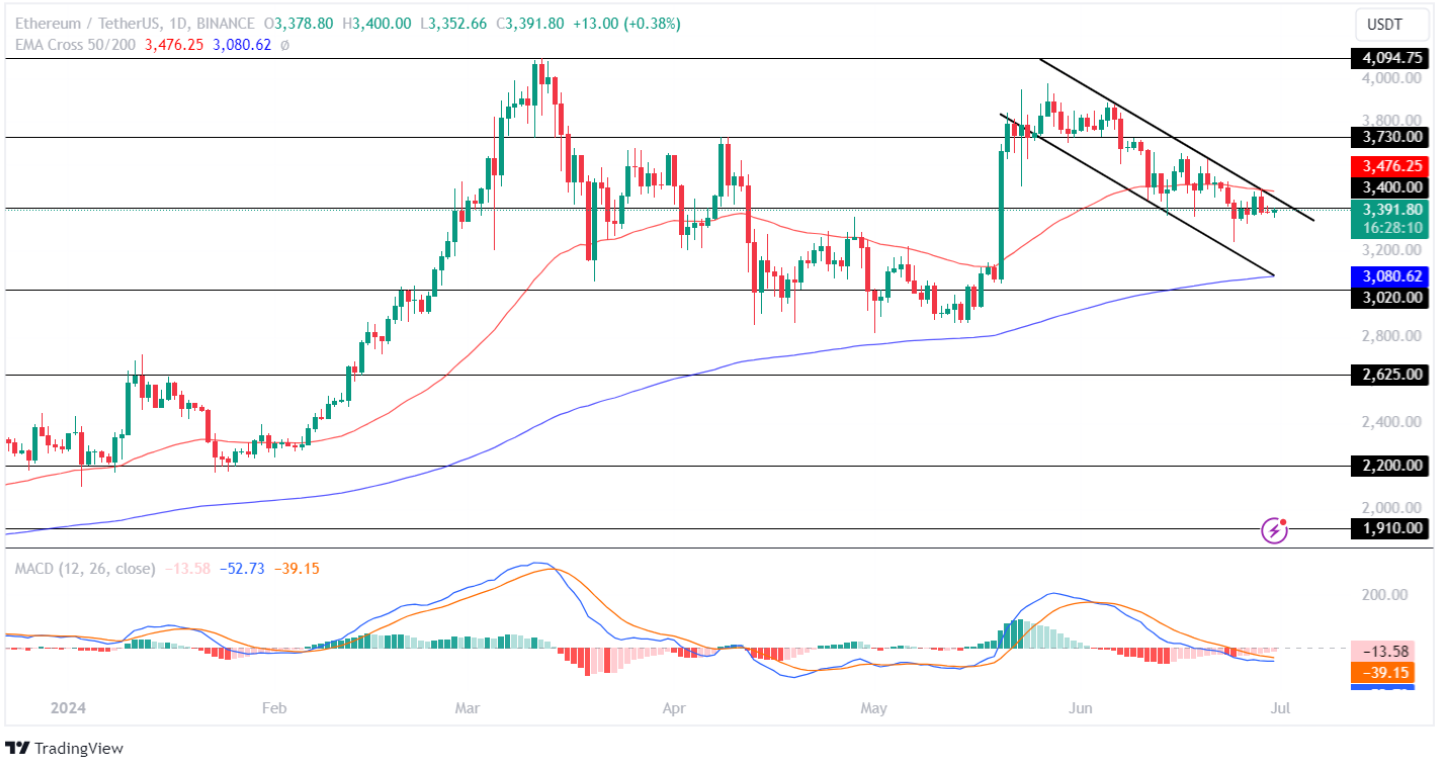
The EMA 50-day constantly acts as a resistance to the ETH price chart in the 1D time frame, suggesting a weak bullish price action for it in the crypto market.
Moreover, the Moving Average Convergence Divergence (MACD) has displayed a constant decline in the red histogram. Furthermore, the averages display a high possibility of a bullish convergence, suggesting a potential positive reversal in the coming time.
If the bulls regain momentum, the ETH price will break out of its resistance trendline and prepare to test its resistance level of $3,730 during the upcoming week. However, if the bears gain control, the Ethereum crypto will plunge toward its lower support level of $3,000.
Ripple Price On The Verge Of Testing Its Crucial Support:
The XRP price has formed a symmetric triangle pattern in the 1D time frame and has continued to trade within it since mid-April. Moreover, with a drop of approximately 3% within the past seven days, the altcoin has plunged close to its crucial support trendline.
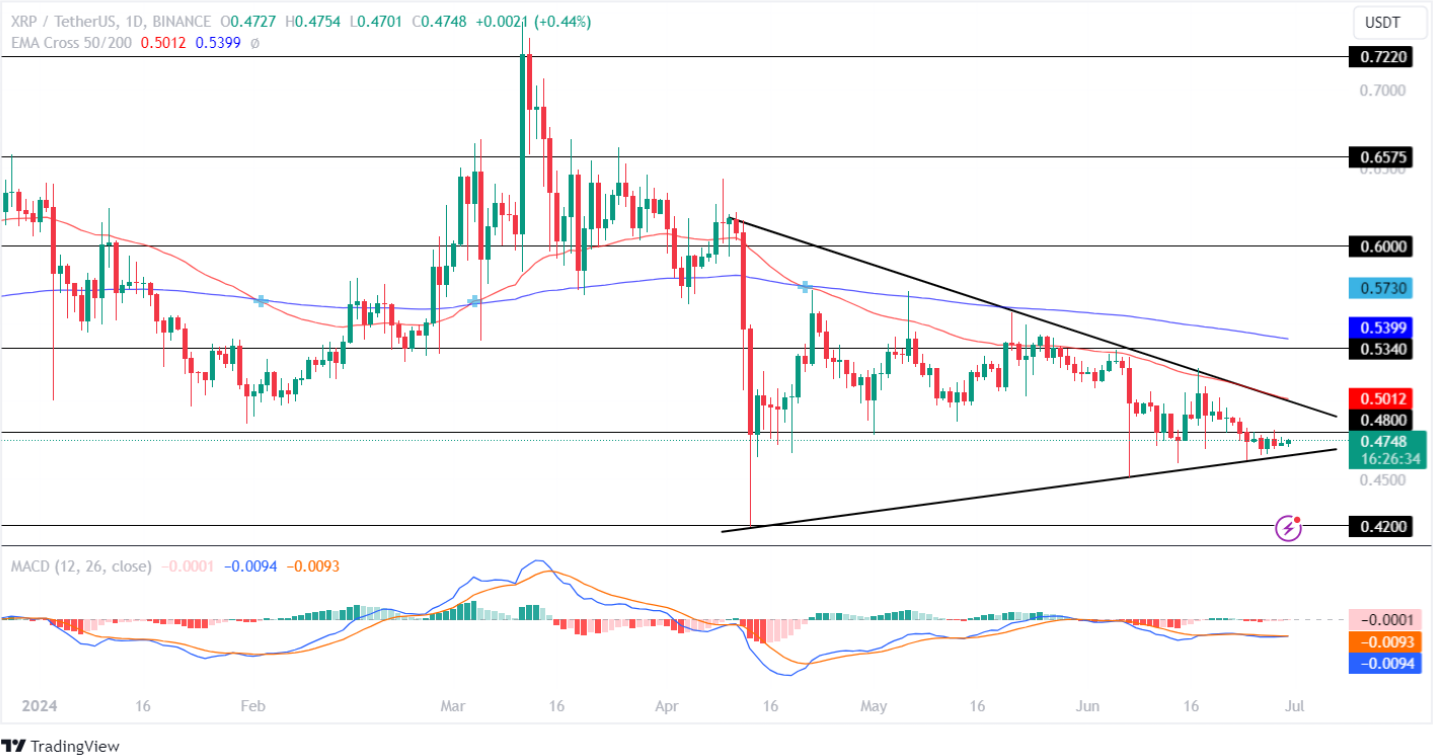
The technical indicator, MACD, displays a constant flatline in its price chart, suggesting weak buying and selling pressure within the crypto space. Moreover, the averages show a neutral trend, highlighting uncertainty in future price action for the XRP crypto.
If the market regains momentum, the Ripple price will prepare to retest its resistance trendline of the symmetric triangle pattern during the upcoming week. Negatively, bearish price action could pull the XRP coin price toward its low of $0.420 in the coming time.
Credit: Source link