Ethereum continues to trade with a bearish consolidation due to Bitcoin’s ongoing failures to break above the $43,000 to $44,000 range since the start of ETF trading. Despite this, Ethereum has shown notable strength compared to Bitcoin following the market correction, with various on-chain metrics signaling positive trends.
Ethereum’s Strong Dominance Against Bitcoin
Bitcoin’s dominance continues to fall, while Ethereum’s surges, as observed on charts. Bitcoin’s dominance has steeply dropped from 55% and it has been declining for the fifth day in a row is commonly seen as a positive sign for altcoins, potentially enabling them to outshine Bitcoin.

This trend is further evidenced by the recent data, which shows Ethereum’s dominance climbing to a three-month high of over 18.5%. On-chain data provider Santiment reports a significant rise in Ethereum’s price dominance relative to Bitcoin, with an increase of 22.4% in the past week.
This period also marked a notable increase in Ethereum network engagement, with the creation of around 90K new Ethereum addresses each day, showing the network’s growing appeal. Particularly striking was the creation of a remarkable 96,300 wallets on January 16.
Ethereum is also doing a lot of network improvements recently as the newest upgrade to the Ethereum network, codenamed “Cancun-Deneb” or “Dencun,” went live on the Goerli testnet for the first time yesterday.
Upon its deployment on the mainnet, the Dencun upgrade is expected to substantially reduce transaction costs on Ethereum’s layer 2 solutions like Optimism, Base, Polygon zkEVM, among others, as claimed by developers. Additionally, this upgrade will restrict self-destruct operations and introduce new functionalities for bridges and staking pools.
Due to the active network upgrades, ETH price is holding investors’ confidence and it has impressively outperformed Bitcoin. According to Tradingview, the ETHBTC ratio has also skyrocketed as it now holds momentum at 0.06.
What’s Next For ETH Price?
Ether is currently experiencing a corrective phase within a triangle pattern, with buyers aiming to maintain the ETH price above $2,450. However, bears continue to dominate as they recently plunged the price below $2,500. As of writing, ETH price trades at $2,473, declining over 2% from yesterday’s rate.
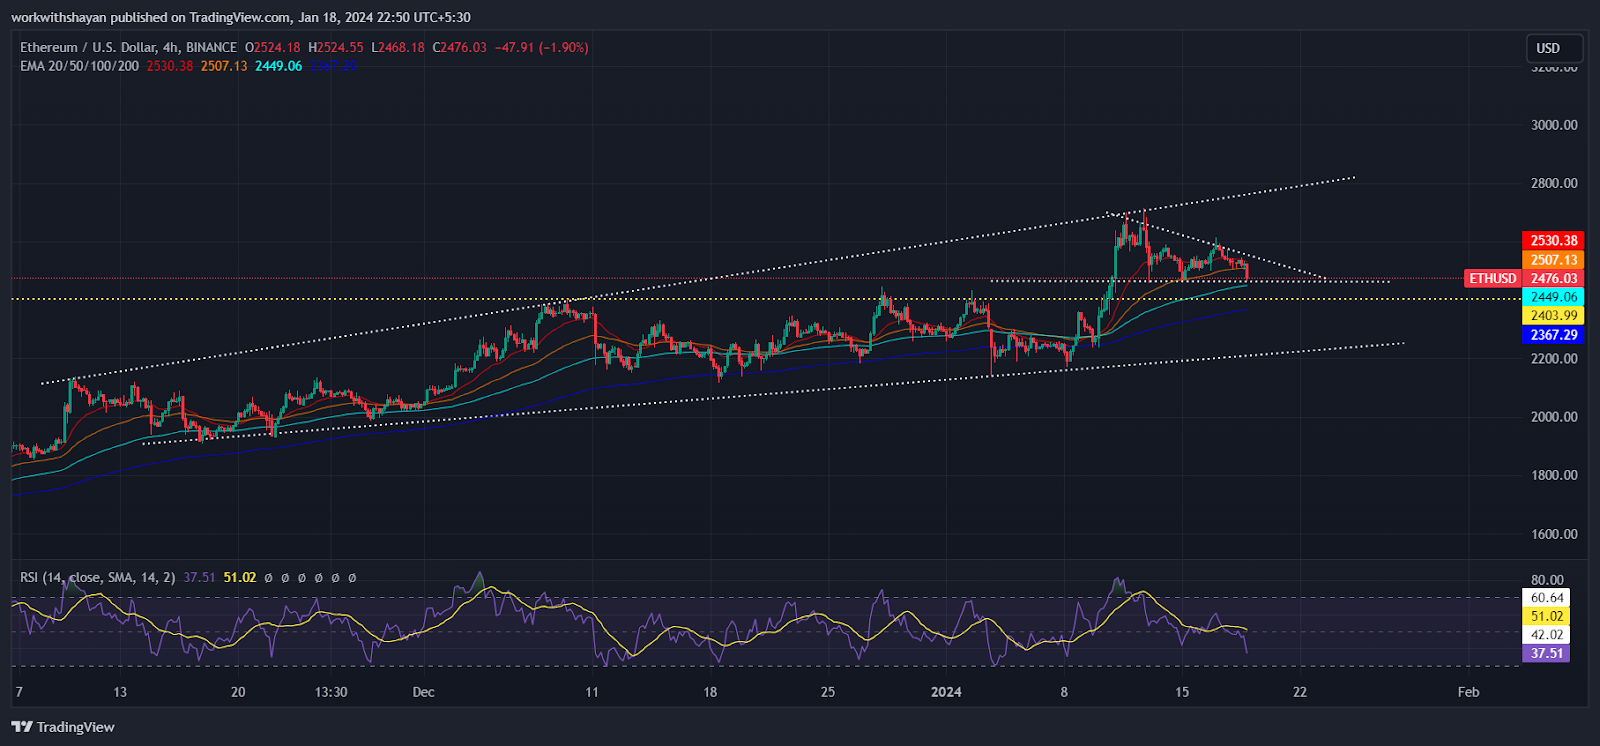
The declining 20-day Exponential Moving Average (EMA) at $2,530 and the Relative Strength Index (RSI) heading toward the selling region suggest that the market momentum is leaning towards the sellers.
A reversal from its present value or a rebound from the $2,400-$2450 zone would indicate a strong inclination for purchasing during dips. Under such circumstances, the ETH/USDT pair could potentially surge to break the pattern at $2,600. Surpassing this threshold might pave the way towards a retest of $2,700 level.
Conversely, this bullish scenario could be invalidated in the short term if the price continues its downward trajectory, falling below $2,400. Such a decline could lead the price towards the critical support zone at $2,130-$2,200.
Credit: Source link