Bitcoin price has broken sharply higher, surging 6.2% to $77,393 and ripping out of a multi-week consolidation range as bearish leverage was caught on the wrong side of the move. BTC climbed from the $65,000–$68,000 area to an intraday high of $79,461, marking a decisive expansion in volatility after weeks of compressed price action. The move was accompanied by a major liquidation wave, with more than $865 million in BTC positions wiped out, heavily skewed toward shorts.
With momentum now approaching the $80,000 mark, the focus shifts to whether Bitcoin can convert this breakout into a sustained trend move.
$742M in Short Liquidations Fuel Bitcoin’s Vertical Move
The derivatives market provides one of the clearest explanations for the speed of Bitcoin’s price rally. According to the liquidation data from Coinglass, $865.38 million in BTC positions were liquidated, including $742.28 million in shorts versus $123.10 million in longs. That means short liquidations represented roughly 86% of total liquidations, creating a substantial forced-buying component behind the breakout.
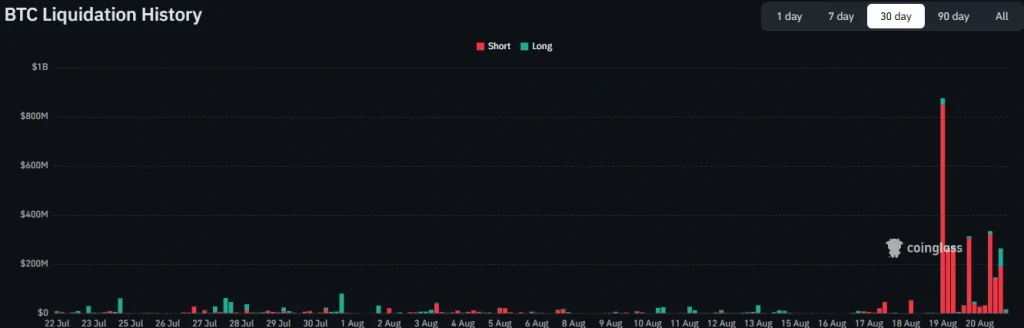
The 12-hour liquidation figure stood at approximately $655.90 million, with about $547.58 million in short positions wiped out. The largest single liquidation recorded was approximately $23.60 million, while total liquidation activity was running at 2.15 times the seven-day average. The next test is therefore whether demand remains after the forced unwind subsides.

BTC Price Analysis: $80K Is Now the First Major Test
Bitcoin spent much of the recent period trapped inside a relatively tight range, trading between roughly $65,000 and $68,000 before the latest breakout. The decisive move above that range has now changed the short-term structure.
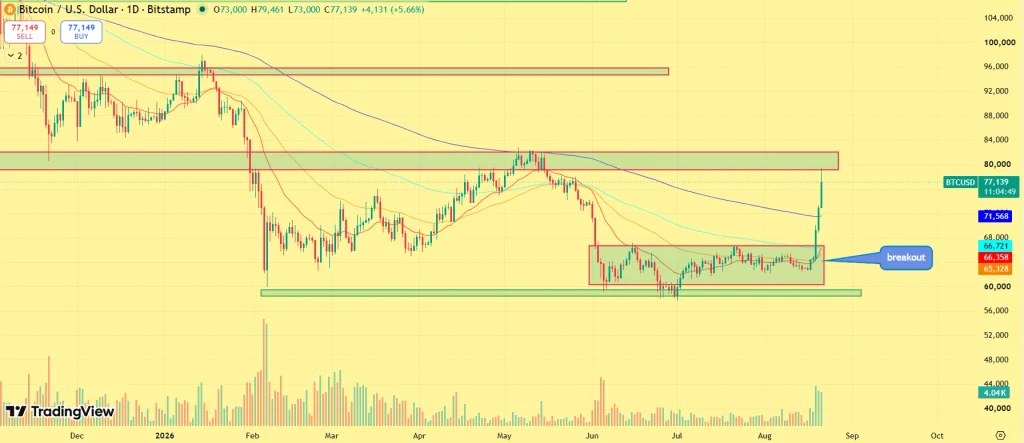
BTC climbed to $79,461 before easing toward $77,293, leaving the market just below the psychological $80,000 threshold. The next major supply zone visible on the daily chart sits around $82,000–$84,000, making this the key resistance area for the current rally. A sustained daily move through $84,000 would significantly strengthen the breakout structure and open the door toward the next major overhead zone near $96,000–$98,000.
On the downside, the first level traders need to watch is the former breakout region around $68,000–$70,000. However, a shallower retracement toward $72,000–$75,000 could still represent a normal post-breakout retest rather than a structural reversal. The critical distinction is whether BTC can establish higher lows above the previous consolidation range.
Bitcoin’s Bull Score Flips Back Into Bullish Territory
The technical breakout is also being supported by improving market-regime signals. The latest Bitcoin Bull Score data shown in the uploaded analysis has moved back above the 60 threshold, entering bullish territory for the first time since October 2025. The indicator currently has 6 of 10 underlying signals turning positive, including measures linked to demand growth, stablecoin liquidity and trader realized price.
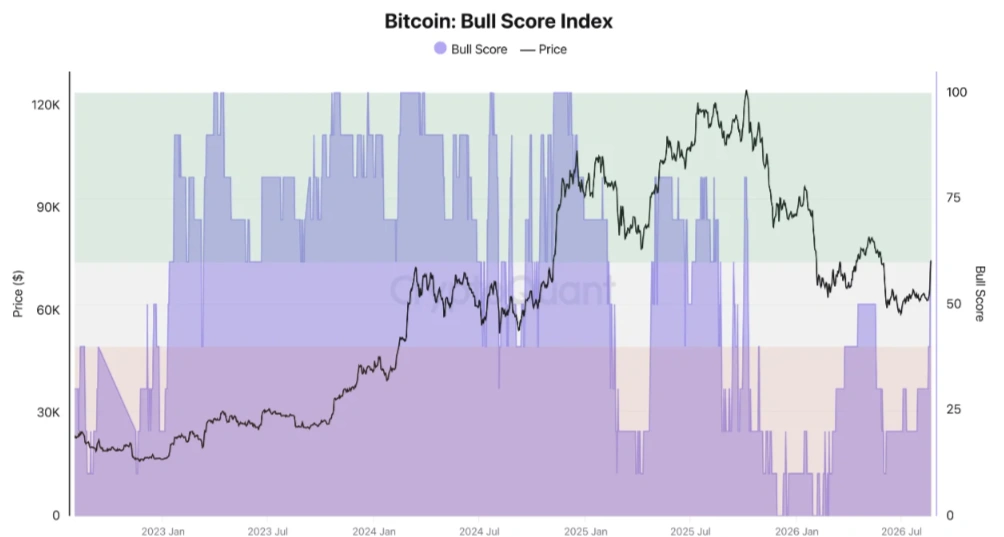
That matters because the previous rally attempt in May, when Bitcoin moved above $82,000, reportedly failed to push the Bull Score into bullish territory. The current improvement therefore provides a different backdrop for the latest price expansion. A sustained reading above 60 would strengthen the argument that the market is transitioning from defensive positioning toward a broader bullish regime.
MVRV Signal Adds Another Layer to the Breakout
Another chart-based signal is emerging from Bitcoin’s MVRV ratio, which is described in the latest market analysis as showing a sharp upward move. MVRV compares Bitcoin’s market value with the realized value of its supply and is commonly used to assess whether the market is moving away from depressed valuation conditions.
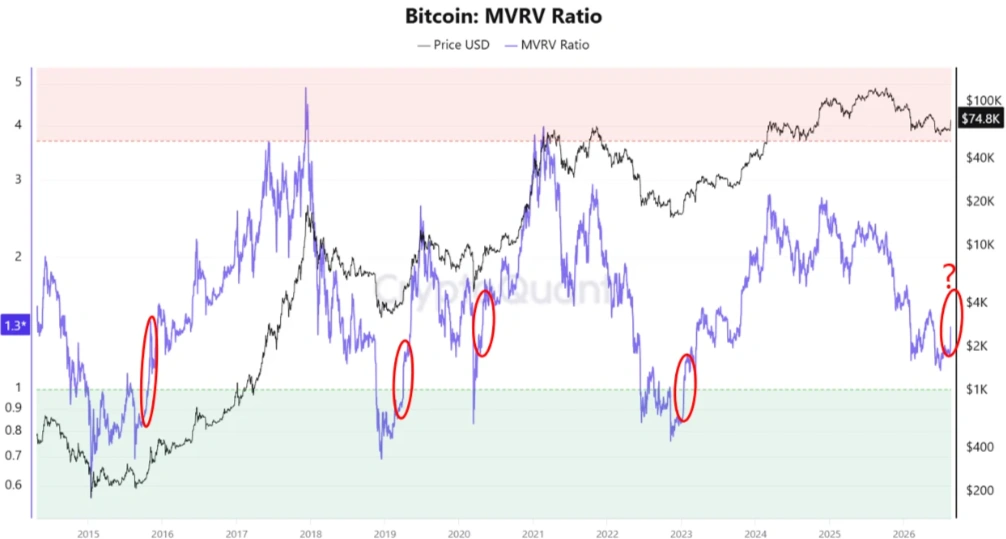
The latest signal is significant because the MVRV trajectory is beginning to resemble the type of recovery historically seen when prolonged downside phases transition into stronger advances. It does not, by itself, confirm a new bull cycle. But combined with the breakout, improving Bull Score and heavy short liquidation, it gives the current move a stronger technical foundation than a standalone price spike would suggest.
Bitcoin Price Outlook: $84K Breakout Could Change the Structure
BTC price has already moved through that threshold with force. The focus is now on $80,000 and the $82,000–$84,000 supply zone. A clean breakout above $84,000, particularly if accompanied by sustained volume and declining dependence on forced short covering, would establish a significantly stronger bullish structure. The next major chart objective would then sit around $96,000–$98,000.
However, traders should not ignore the possibility of a post-squeeze retracement. With $742 million in short positions already liquidated, part of the immediate upside pressure has come from forced buying. A pullback after such an aggressive move would not necessarily invalidate the breakout.
The key level is the former range ceiling. If BTC can hold above $70,000 and build support between $72,000 and $77,000, the breakout remains structurally constructive. A sustained move above $84,000 would be the stronger confirmation that Bitcoin has entered a new expansion phase.
Credit: Source link