- The Bitcoin price wavering in consolidation revealed the formation of a bearish continuation pattern called inverted pennant.
- Binance records a notable spike in whale inflow, suggesting an increased supply of coins available for trading.
- Crypto fear and greed index at 10% indicate a pessimistic sentiment among market participants.
The Bitcoin price is down roughly 2% during Tuesday’s U.S. market hours to exchange hands at $67,521. The downtick tracked declines in tech stocks and gold amid renewed geopolitical tension, indicating a shared macro-driven move. The selling pressure keeps BTC wobbling in a narrow range around $70,000 projecting lack of initiation from buyers or sellers. In addition, the on-chain data shows a decisive spike in Whale Inflow Ratio, suggesting a heightened large-holder activity and risk for prolonged correction ahead.
Whale Transfers to Exchanges Suggest Potential Volatility Ahead for BTC
On-chain metrics from CryptoQuant show interesting spikes in the activity of large holders on Binance during the current Bitcoin market downturn. A measure called whale inflow ratio – which divides Bitcoin deposits from the ten largest transactions by overall inflows to the exchange, then smoothes with a seven-day moving average – jumped from about 0.40 to 0.62 between February 2 and February 15.
This shift shows that a significantly larger amount of incoming BTC for that time period came from major wallets, on scales not seen in over two years. Such patterns are often correlated with increased availability of coins to trade on the platform as large participants transfer assets from personal storage to exchange accounts.
Analysts attribute the uptick to a number of factors. One individual who comes to mind is a wallet belonging to Garrett Jin, sometimes referred to as the “19D5” or “Hyperunit whale,” who transferred almost 10,000 BTC to Binance in recent weeks. Beyond this solitary player, wider data exists of various significant transfers flowing to the exchange because of its high liquidity amidst volatile conditions.
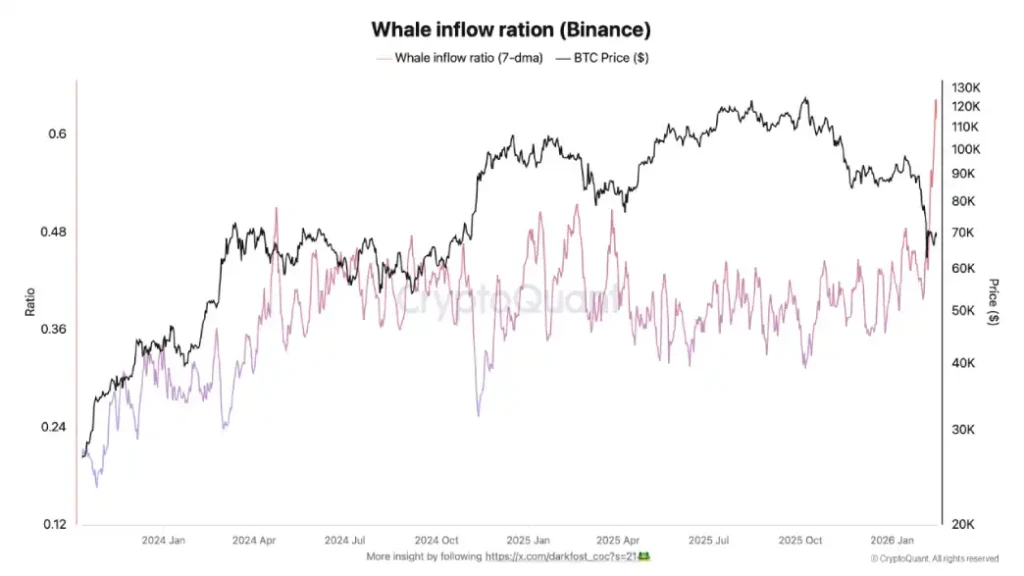
The surge comes as Bitcoin has pulled back from previous highs, with prices lingering around $67,000-$68,000 in mid-February after testing lower ranges. Investors in all categories seem to be adjusting positions against uncertainty, resulting in high exchange deposits from big holders.
Historically, whales moving BTC to exchange has coincided with major market corrections and heightened selling pressure.
Bitcoin Price Analysis Reveals Key Bearish Continuation Pattern
The Bitcoin price has been wavering around $70,000 for the past two weeks. The consolidation struggles to sustain a long divergence from the aforementioned level, suggesting lack of confidence for buyers or sellers.
However, a deeper analysis of the 4-hours chart shows that price action has been resonating within two converging trendlines which revealed the formation of inverted pennant pattern. The prevailing downtrend displayed with a long downsloping trendline and a triangle formation shows the pattern formation.
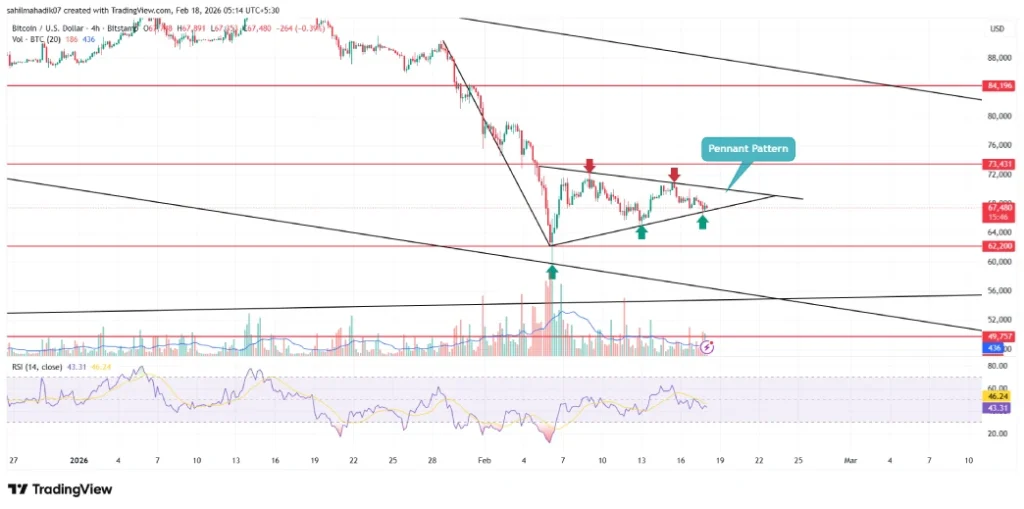
Theoretically, this triangle acts as a breathing period for sellers to replenish bearish momentum before the next breakdown. If the chart setup holds true, the Bitcoin price is poised for a bearish breakdown from the pattern’s bottom trendline at $67,200, and the post-breakdown fall could push the asset another 18% down to hit $55,000.
Credit: Source link