Crypto markets entered the week expecting heightened volatility ahead of key macro triggers, including U.S. unemployment data and the Supreme Court’s ruling on Trump-era tariffs. While a brief bullish push lifted prices across Bitcoin, Ethereum, and major altcoins, the move lacked follow-through. Selling pressure quickly returned, forcing prices back into their respective ranges. As a result, Ethereum—the second-largest crypto—has drifted into a critical phase.
With the ETH price compressing sharply, derivatives data now reveals why this consolidation persists. Leverage is building on both sides, turning indecision into pressure. Ethereum is no longer drifting—it’s coiling. The key question now is what comes next.
ETH Liquidation Map Signals a High-Risk, High-Volatility Zone
Ethereum’s derivatives market is showing clear signs of stress. The ETH liquidation map reveals a dense buildup of leveraged positions on both sides of the price, creating a high-risk zone where even a modest move could trigger forced liquidations and sudden volatility.

The ETH liquidation map highlights a rare and dangerous setup for overleveraged traders.
- Around $1.64 billion in short liquidations sit above current price levels
- Nearly $1.05 billion in long liquidations are clustered below
- A ~10% move in either direction could trigger cascading forced exits
This tells us the market is balanced on leverage, not conviction. When liquidation pressure builds on both sides like this, ETH typically remains choppy until price breaks structure—and once it does, the move tends to be fast and unforgiving.
ETH Price Compresses Inside a Symmetrical Triangle
Ethereum’s price action reflects growing indecision. ETH is trading inside a tightening symmetrical triangle, a structure that typically forms when buyers and sellers are evenly matched, and volatility is being compressed ahead of a decisive move. On the daily ETH/USDT chart, price action confirms what the liquidation data is warning. ETH is trading inside a symmetrical triangle, marked by lower highs descending from the $3,300–$3,350 region and higher lows rising from the $2,850–$2,900 support zone.
This structure reflects volatility compression, where buyers and sellers are evenly matched while leverage quietly builds. Volume remains muted, reinforcing the idea that ETH is waiting for a trigger—not trending organically.
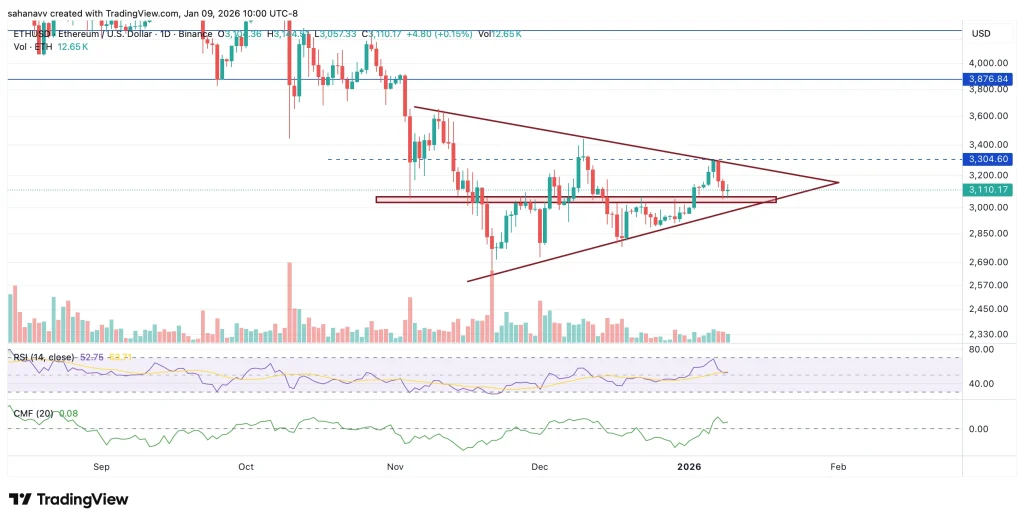
RSI on the daily chart is hovering near the neutral 50 level, showing no momentum extreme and confirming that ETH is in a wait-and-see phase rather than an overbought or oversold condition. A push in RSI above 60 would likely accompany a breakout above $3,300–$3,350, signaling bullish continuation. Conversely, a drop below 40 would align with a breakdown below $2,950–$2,900, increasing downside risk.
At the same time, Chaikin Money Flow (CMF) remains slightly positive, indicating mild capital inflows even as the price compresses inside the triangle. This suggests quiet accumulation rather than distribution. If CMF stays positive during a breakout, ETH could accelerate toward $3,500–$3,600. However, a flip into negative territory would support a downside flush toward $2,700–$2,600.
Together, neutral RSI and positive CMF reinforce that ETH is coiled at a decision point, with indicators supporting a reactive trade based on price confirmation rather than anticipation.
Bottom Line
Ethereum is nearing a critical turning point. With over $1 billion in liquidations positioned on both sides and price compressing inside a symmetrical triangle, the next move is likely to be sharp and decisive. ETH is not trending—it is coiling under heavy leverage. A confirmed break above $3,300–$3,350 could trigger a short squeeze toward higher resistance, while a drop below $2,900 risks a rapid long flush. For traders, patience is key. The edge lies in reacting to confirmation, not anticipating direction.
Trust with CoinPedia:
CoinPedia has been delivering accurate and timely cryptocurrency and blockchain updates since 2017. All content is created by our expert panel of analysts and journalists, following strict Editorial Guidelines based on E-E-A-T (Experience, Expertise, Authoritativeness, Trustworthiness). Every article is fact-checked against reputable sources to ensure accuracy, transparency, and reliability. Our review policy guarantees unbiased evaluations when recommending exchanges, platforms, or tools. We strive to provide timely updates about everything crypto & blockchain, right from startups to industry majors.
Investment Disclaimer:
All opinions and insights shared represent the author’s own views on current market conditions. Please do your own research before making investment decisions. Neither the writer nor the publication assumes responsibility for your financial choices.
Sponsored and Advertisements:
Sponsored content and affiliate links may appear on our site. Advertisements are marked clearly, and our editorial content remains entirely independent from our ad partners.
Credit: Source link