Close Menu
  • Home
  • Crypto News
  • Tech News
  • Gadgets
  • NFT’s
  • Luxury Goods
  • Gold News
  • Cat Videos
What's Hot

HDMI 2.0 Vs 2.1: Why You Don’t Need The Upgrade For Streaming

June 23, 2026

Dogecoin Heads Toward Yearly Lows as Selling Pressure Builds — What’s Next for DOGE Price?

June 23, 2026

Cat 🐱 Revers video #cat #cats #catvideos #catshorts #catlife #catvideo #catshort #billi #viralvideo

June 23, 2026
Facebook X (Twitter) Instagram
  • Contact Us
  • Disclaimer
  • Privacy Policy
  • Terms of Use
  • DMCA
Facebook X (Twitter) Instagram
KittyBNK
  • Home
  • Crypto News
  • Tech News
  • Gadgets
  • NFT’s
  • Luxury Goods
  • Gold News
  • Cat Videos
KittyBNK
Home » FET Bullish Divergence Hints at 45% Surge, Buy Signal?
Crypto News

FET Bullish Divergence Hints at 45% Surge, Buy Signal?

February 20, 2025No Comments2 Mins Read
Facebook Twitter Pinterest LinkedIn Tumblr Email
FET Bullish Divergence Hints at 45% Surge, Buy Signal?
Share
Facebook Twitter LinkedIn Pinterest Email

After witnessing a 65% price drop over the past two months, the Artificial Superintelligence Alliance (FET) appears ready for takeoff, supported by bullish price action on both weekly and daily time frames. With an ongoing price recovery, FET tokens are gaining significant attention from traders and investors, which could help the asset rebound soon.

Current Price Momentum 

Today, February 21, 2025, FET is trading near $0.778 after surging over 9.50% in the past 24 hours. During the same period, its trading volume increased by 17%, indicating growing interest from investors and traders compared to the previous day.

FET Technical Analysis and Upcoming Levels

According to CoinPedia’s technical analysis, FET appears bullish and is poised for significant upside momentum, as its technical indicators are flashing a bullish divergence on the weekly time frame. Additionally, FET seems to be forming a bullish double-bottom price action pattern and is currently on the verge of completing its second upward leg.

FET Bullish Divergence Hints at 45% Surge, Buy Signal?
Source: Trading View

Based on historical patterns, if the asset holds above the $0.70 level, there is a strong possibility it could surge by 45% to reach $1.10 in the coming days and by 165% overall to reclaim the $2.05 level, which FET lost in December 2024.

Investors Bearish Outlook

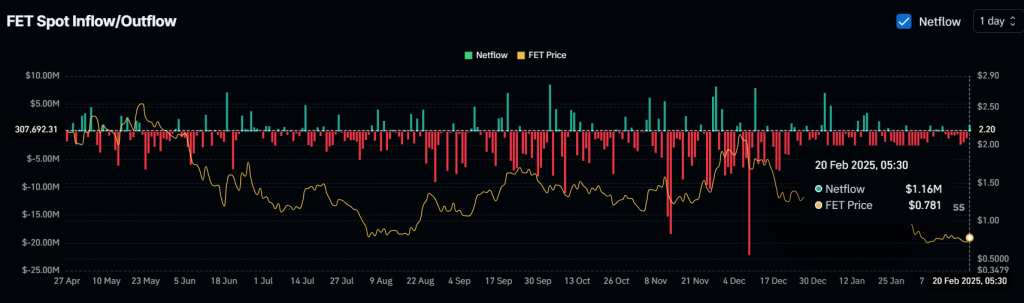
Despite bullish momentum, some investors are offloading FET, as reported by the on-chain analytics firm Coinglass. Data reveals that exchanges have witnessed an outflow of approximately $1.50 million worth of FET tokens, suggesting that some holders have sold off their positions.

Source; Coinglass

Major Liquidation Levels

Meanwhile, traders betting on the long side are currently dominating the asset. At press time, the over-leveraged levels are $0.731 on the lower side and $0.785 on the upper side, where traders have built millions worth of long and short positions. Data shows that traders hold $1.03 million worth of long positions at the $0.731 level and $270,000 at the $0.785 level.

When combining these on-chain metrics, it appears that some traders are taking advantage of the current market sentiment, while others, driven by fear, are dumping the asset.

Credit: Source link

Share. Facebook Twitter Pinterest LinkedIn Tumblr Email

Related Posts

Dogecoin Heads Toward Yearly Lows as Selling Pressure Builds — What’s Next for DOGE Price?

June 23, 2026

XRP Price Prediction For June 24

June 23, 2026

XRP Reaches a Critical Turning Point! World Cup Boosts Global Payments, Potential Gains of 600%, Target $1,100

June 23, 2026

New Crypto Presale Sells Out Every Few Days

June 23, 2026
Add A Comment
Leave A Reply Cancel Reply

What's New Here!

How to send animated reactions on FaceTime with iOS 17

October 2, 2023

❤😻🐾Cute kitten #cat #lovecats #cats #catvideos #kittens #catlover #princesscat #kitten Cute kitten

November 15, 2024

UXLINK Rolls Out NFT Airdrop for Top Users

May 7, 2024

Benefits of Gaming : Stress Relief, Focus & Social Connections

October 22, 2025

BNB Price Breakout Above $600? On-Chain Metrics Hint at Bullish Momentum

April 18, 2025
Facebook X (Twitter) Instagram Telegram
  • Contact Us
  • Disclaimer
  • Privacy Policy
  • Terms of Use
  • DMCA
© 2026 kittybnk.com - All Rights Reserved!

Type above and press Enter to search. Press Esc to cancel.