- The Bitcoin price consolidation reveals the formation of a bearish continuation pattern called inverted flag, signaling the risk of prolonged correction ahead.
- Bitcoin transfer volume on the blockchain has shown a consistent drop since the beginning of 2023.
- BTC price drops below the 50-day exponential moving average, reinforcing the bearish narrative in the market.
The pioneer cryptocurrency Bitcoin is down roughly 3% during Wednesday U.S. market hours to currently trade at $91,000. The pullbacks showed intact supply pressure at $94,000 and BTC’s third failed attempt to breach this resistance since December 2025. The selling pressure also gained momentum as U.S. based spot Bitcoin ETF recorded a substantial volatility of $243.2 million. Is Bitcoin price heading for $80,000 again.
BTC’s On-Chain Activity Remains Subdued Despite Price Gains
In the first five days of 2026, the Bitcoin price witnessed a bullish rebound from $87,268 to a recent high of $94,792. This upswing renewed market sentiment and raised investor expectations for further recovery ahead.
However, in a recent tweet analyst AxelAdlerJr highlighted that the value of the aggregate amount of Bitcoin transfers recorded on the network has been on a persistent downward trajectory since early 2023. This trend persisted in 2025 and continues in 2026, as transactions volume and other metrics indicate less movement of funds between addresses.
While the price of bitcoin on the market has shown upward momentum during this time, the network usage has not followed. On-chain indicators such as smaller transfers from retail-sized users and transaction counts suggest reduced participation from everyday users as compared to earlier cycle phases.
Several external factors seem to be involved in the current price environment. The introduction and growth of spot Bitcoin exchange traded funds have made it easier for institutional capital to get in. Additionally, some corporations have invested part of their reserves in Bitcoin and some positive statements from political personalities in the United States helped to raise awareness. Prominent voices in the cryptocurrency space have also reinforced positive messaging via multiple channels.
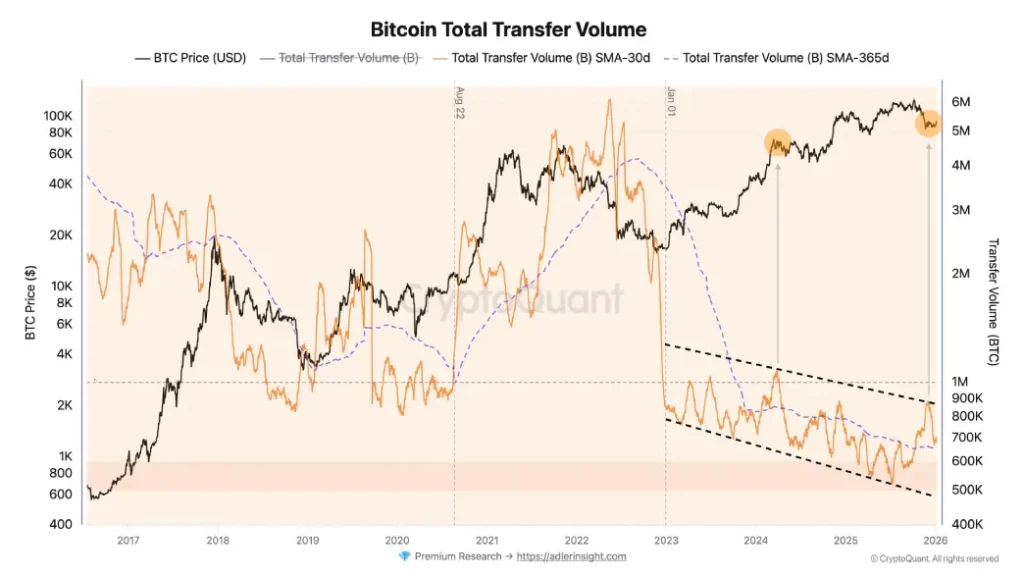
Market participants are making a choice about holding their positions in the expectation that the value will be further appreciated, rather than making frequent transfers on the blockchain. This behavior is consistent with the patterns where holding is more important than active trading or spending on the base layer.
Bitcoin Price Face Consolidation Within Bear Flag Pattern
Over the past seven weeks, the Bitcoin price has recorded a sideways trend, struggling to sustain above $95,000. The daily chart highlighted notable swing on either side but no sustainability, suggesting lack of initiation from buyers or sellers.
However, a deeper analysis into BTC’s chart shows that the consolidation followed a notable downtrend in recent momentum and remained within the boundaries of two converging trendlines, indicating the formation of a bear flag pattern.
The chart setup is known to replenish the exhausted bearish momentum for sellers to regain control and drive further correction. The Bitcoin price is currently trading at $91,008, standing just 2.5% short from challenging the pattern’s bottom trendline.
The coin price holding below the 100-and-200-day EMA slope indicates that the broader sentiment is bearish.
A downside breakdown below this floor would accelerate the selling pressure and may extend the prevailing correction to $81,000 for another breakdown.
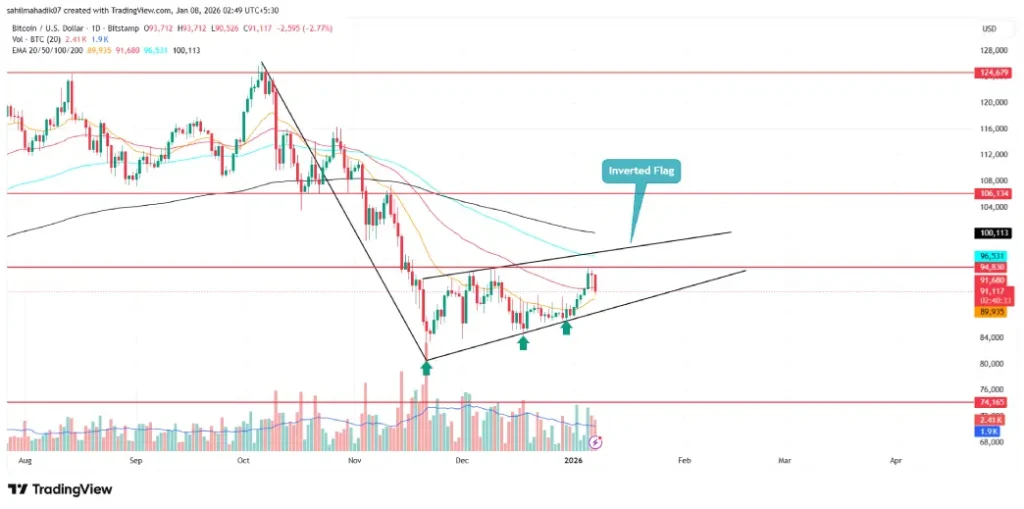
On the contrary note, if the Bitcoin price breaks above the upper boundary of the flag, the buyers could reattempt to strengthen their grip over this asset.
Credit: Source link