The journey of the Bitcoin market in the year 2024 is something that is very interesting to analyse. What makes it special is it is characterised by significant buying and selling pressures. One notable thing is we even saw an all-time high in March. If we analyse this journey using the right data-based indicator, we can have a closer look at this interesting journey and get more insights about it. The perfect data-based indicator that we can use for this purpose is Bitcoin’s Spot Cumulative Volume Delta data.
Here what we are trying to do is to use the said data to analyse the journey of Bitcoin in the year 2024. Be patient and go through every detail carefully!
Before we start, let me give you an idea about what Spot Cumulative Volume Data is. In simple words, it measures the net buying and selling pressure by tracking the cumulative difference between buy and sell volumes. If we see a positive value as CDV, it means what the market has selling dominance. The opposite is the case when a negative value is shown.
Let’s dive straight into the analysis part!
Bitcoin’s Spot Cumulative Volume Delta Data: A General Analysis
Time to explain what the data shows. In early 2024, a significant positive CVD was recorded, indicating buying pressure. It conceded with the event of the price of BTC reaching the all-time-high in mid-March 2024. Undoubtedly, the launch of Spot Bitcoin ETFs and the growing interest in Bitcoin from institutional investors were the two price reasons why the market witnessed a positive momentum in the early months of 2024.
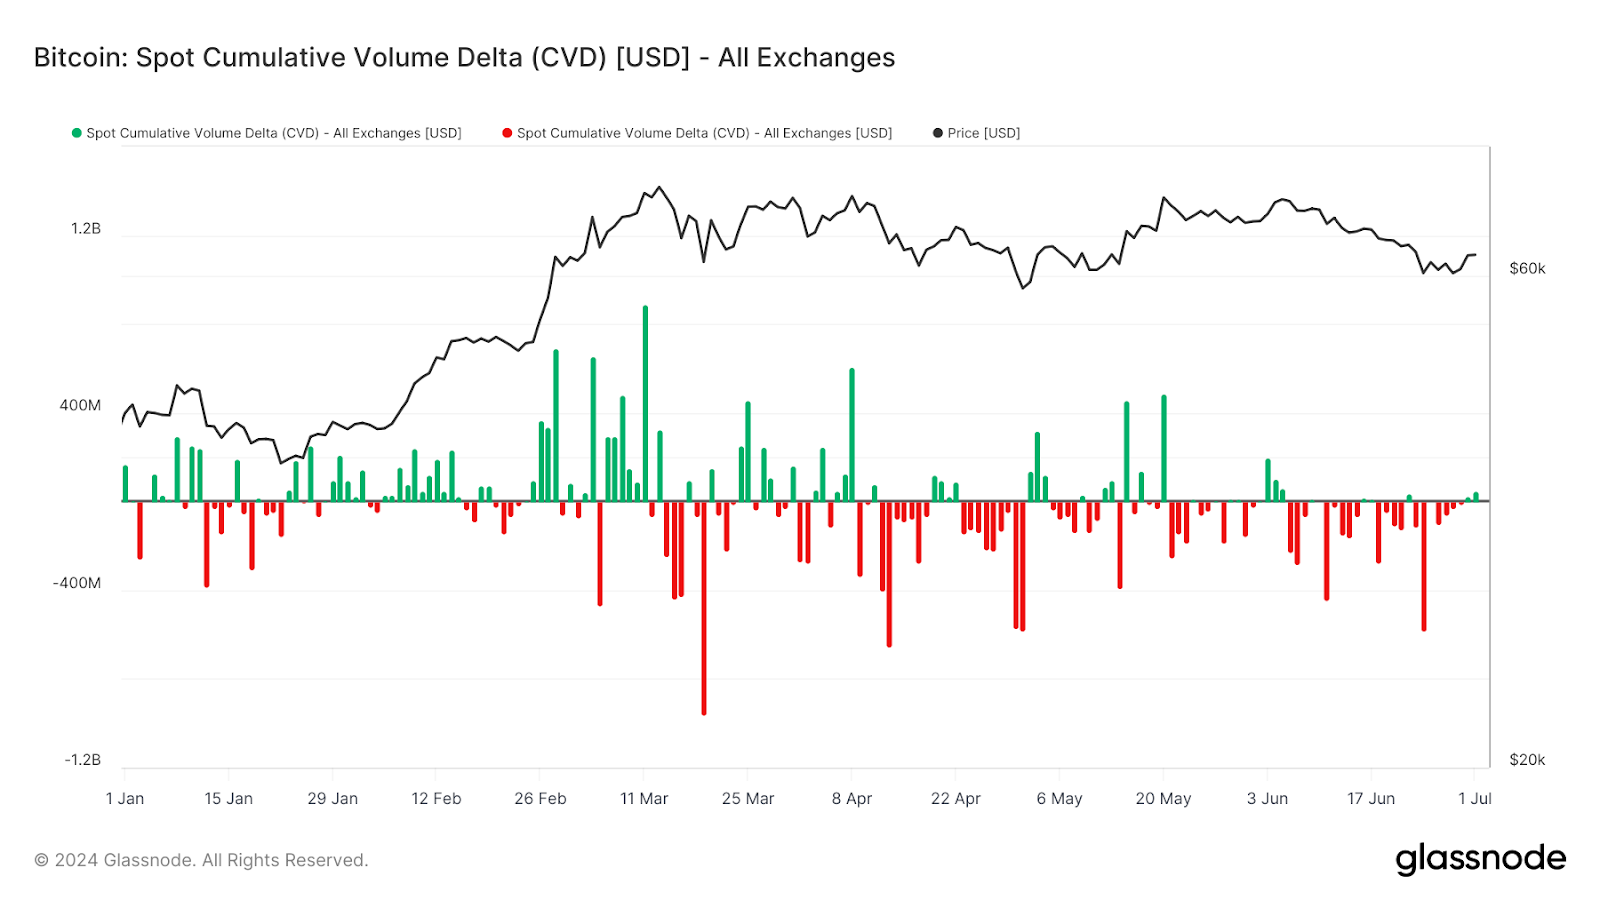
Interestingly, post-halving, the CVD data showed fluctuating volumes with occasional spikes in buying activity. As per the data, the market experienced substantial selling in May and June. An assumption is that this selling pressure witnessed was the reason for the temporary precise corrections observed lately in the market.
Long-Term CVD Chart: Historic Trend Analysis
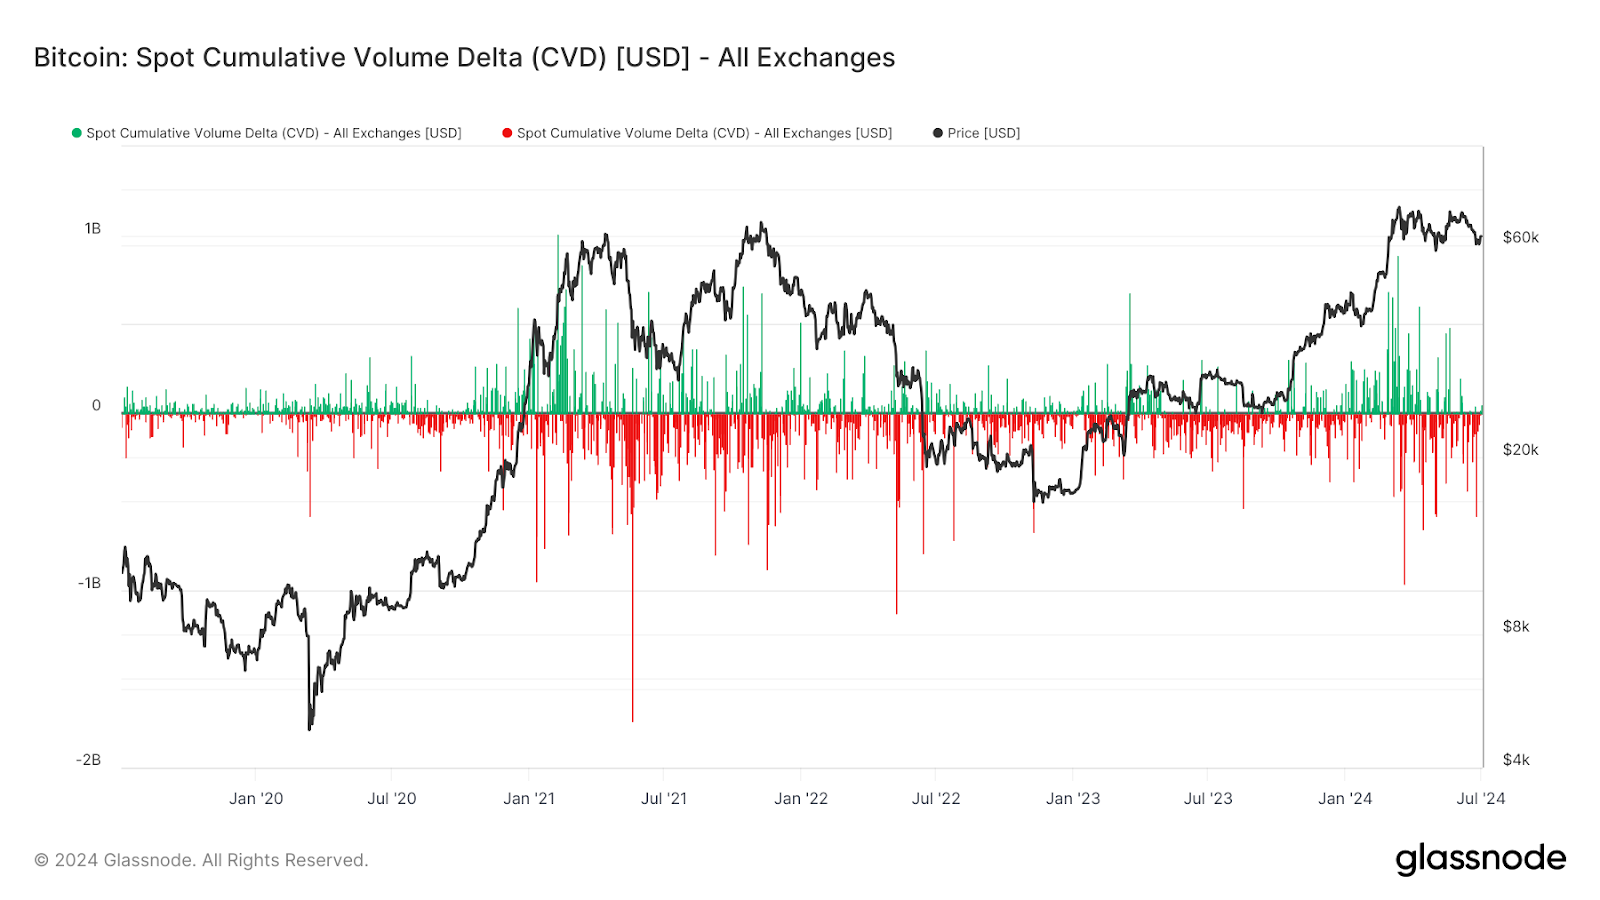
To get a better picture about the situation, let’s analyse the long-term CVD chart. When we go through this chart, what it reveals is that there will be cyclical patterns of intense buying and selling activities aligned with Bitcoin’s price cycles. The significant buying volumes in late 2020 and early 2021, followed by selling periods in 2022, proves that the cycle nature of the Bitcoin market behaviour is not a myth.
Bitcoin current Price Trends
To get more clarity about the situation, it is pertinent to understand the present Bitcoin price trends. At present, the price of Bitcoin stands at $61,000.07. It marks a 1-year change of +98.8%. In the past 30-days, it has seen an 11.0% decline. Nearly 6.8% drop has been observed in the last 14 days. In the past week, it has only seen a drop of 1%.
Let’s have a deeper look at the journey of the Bitcoin price this year. In the beginning of the year 2024, the price of BTC was around $44,168. A sharp uptrend started in late-January. The trend culminated in mid-March, pushing the price above $73,000. Later, the price moved to a sideways market, in which price majorly oscillated between $71,700 and $58,000. Last month, on June 5, the price was over $71,000. Since then, the price has been weakening sharply.
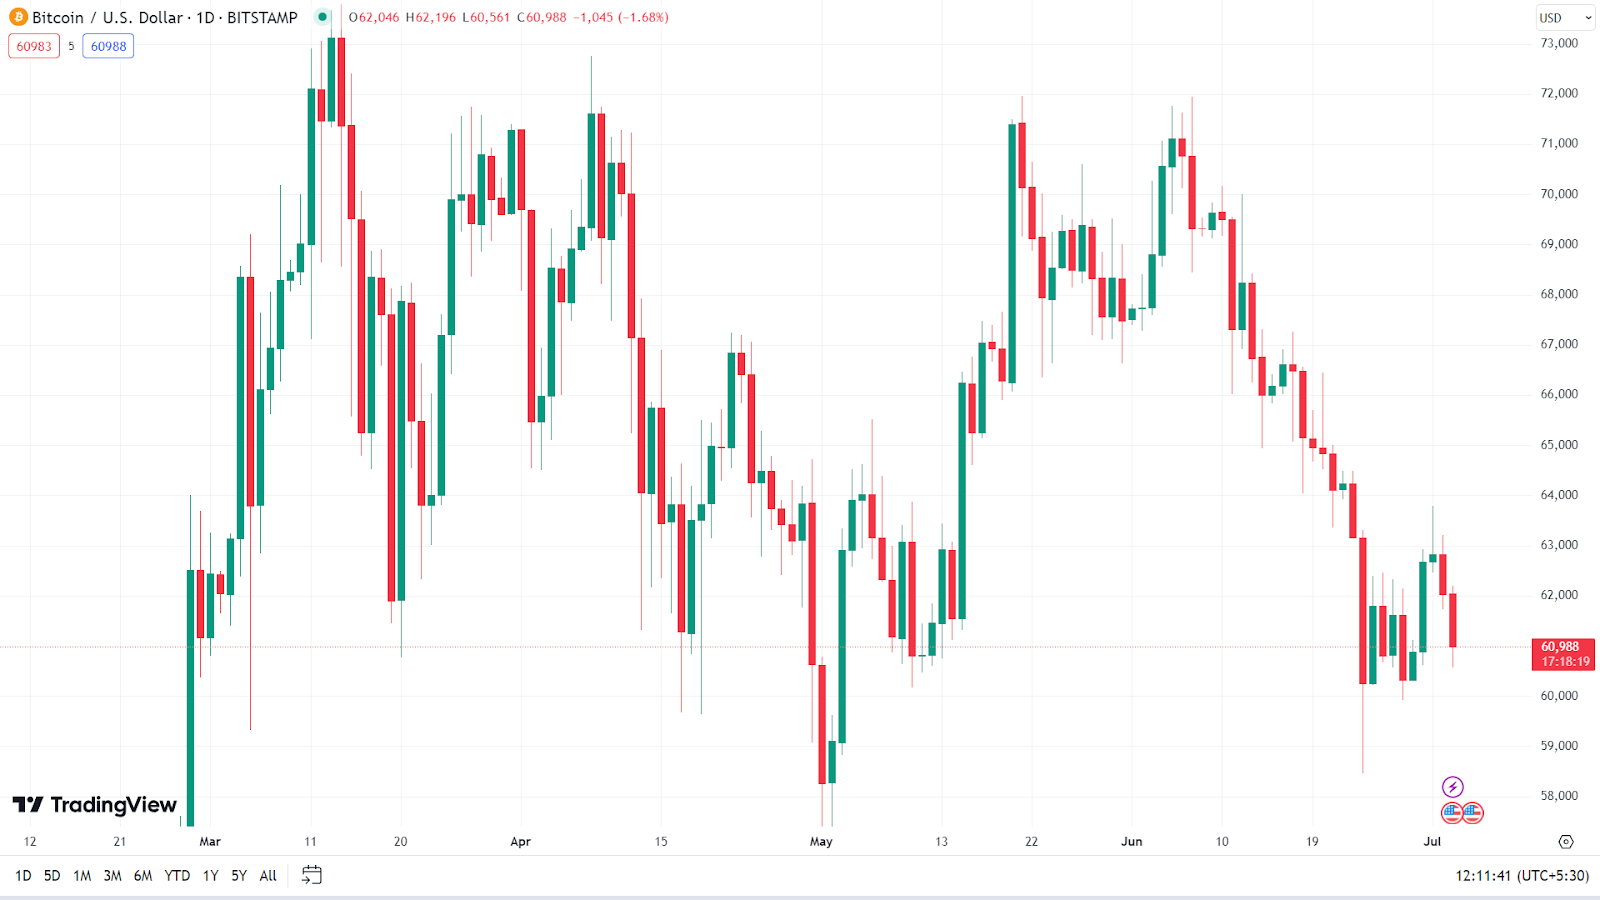
In the last seven days, the price oscillated between $62,900 and $60,000. On June 30, the Bitcoin daily chart showed a green candle, with a closing price of around $62,500.
Considering what the CVD data, historic trend and the price trend show, we can research a conclusion that despite short-term fluctuations, the underlying buying pressure and institutional interest suggest a bullish long-term outlook.
Read Also : Is Bitcoin Price Repeating A Warning Signal? No Confirmation Of Push Beyond $70k
Credit: Source link