
- The Bitcoin price prolongs its downtrend with the formation of a falling channel pattern.
- Lark Davis flagged a bearish weekly MACD crossover in Tether’s market cap, signalling a reduced dollar inflows into crypto markets.
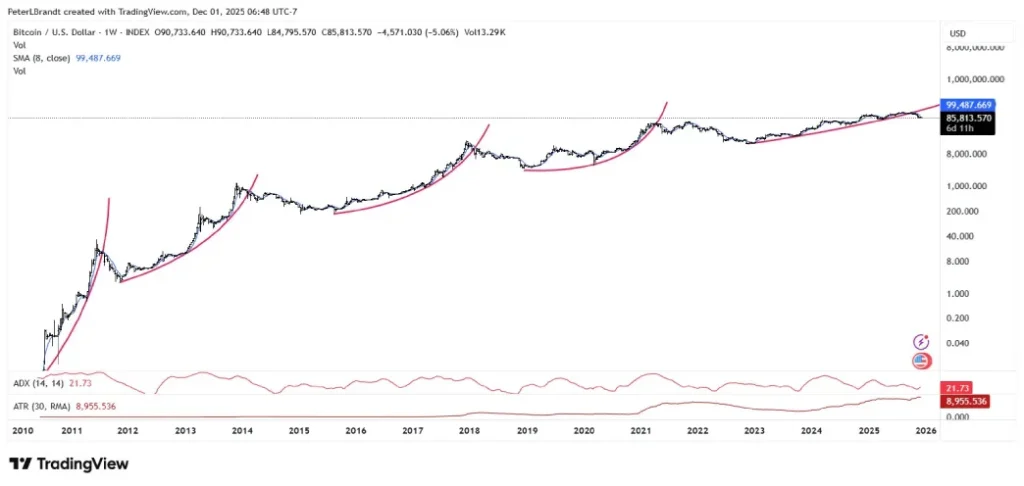
- Peter Brandt highlighted that Bitcoin has completed five major parabolic runs since 2009.
The pioneer cryptocurrency Bitcoin recorded a sharp sell-off of over 7% on Monday, plunging to $85,000 mark after briefly falling to $83,814. Several interconnections factors fueled this downturn including, Japan’s central bank signaling tighter policy, expectations for interest rate cut in December by U.S. Federal Reserve has cooled down, and a significant liquidation. The selling pressure led to another lower high formation in Bitcoin price signalling a risk of prolonged correction.
BTC Faces Downside Risk as Analysts Flag Major Technical Red Alerts
In the last two months, the Bitcoin price has plunged from $125,725 to current trading value of $85,000, registering a 33% decrease. The two separate technical warnings from widely followed analysts have added to the bearish sentiment in trading circles.
Crypto enthusiast Lark Davis highlighted that the market capitalization of Tether (USDT), the largest dollar-pegged stable coin, recently witnessed a bearish crossover in its weekly MACD indicator. Historical examples of this signal on a similar timeframe have preceded a sharp drop in dollar inflows in the sector, almost always translating to a decline of between fifteen to twenty-one percent in Bitcoin within the following weeks. The current arrangement is similar to the previous episodes, with the USDT supply curve levelling after months of rising.
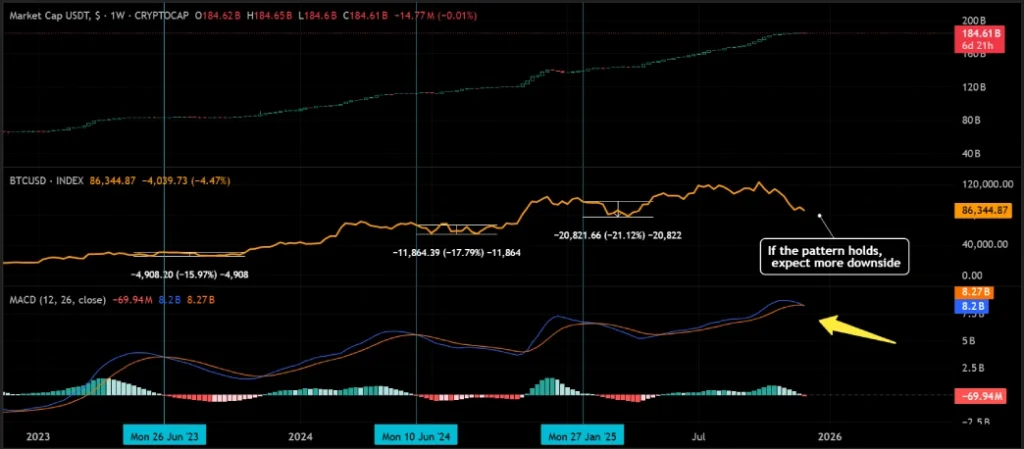
Separately, veteran chartist Peter Brandt issued a reminder that Bitcoin has been in five major upward parabolic phases since 2009. In all previous instances, after the price pattern broke below the main advancing curve that characterized the bull run, the correction that followed amounted to more than seventy-five percent from the peak of the cycle. Brandt emphasized the fact that no previous cycle has deviated from this result, making it exceptional justification for any trader to position against a similar move now.
Both observations purely focus on recurring price and focus on-chain patterns and not external events. Markets are still digesting the implications as liquidity conditions tighten and leverage long positions are subjected to more margin pressure.
Bitcoin Price Gains Bearish Momentum Amid a Bear Cycle of Channel Pattern
Following a sluggish weekend, the Bitcoin price printed a sharp intraday downturn, creating a new lower-high formation in the daily chart. A series of such lower swings indicate a sell-the-bounce sentiment among market participants, bolstering further correction in price.
With more than 7% drop, BTC traders witnessed a nearly $349 million in long liquidation, pulling more sell orders in the market.
If the selling pressure persists, the coin price could plummet another 14.6% and revisit the bottom trendline of a falling channel pattern at $73,600. The chart setup has been carrying a steady correction in BTC as price constantly resonates between the two parallel lines, acting as dynamic resistance and support.
The potential retest could trigger a brief recovery in Bitcoin price to encourage a potential swing towards resistance trendline. However, until the coin remains within the range of channel pattern, the sellers could have a tighter grip over price trajectory.
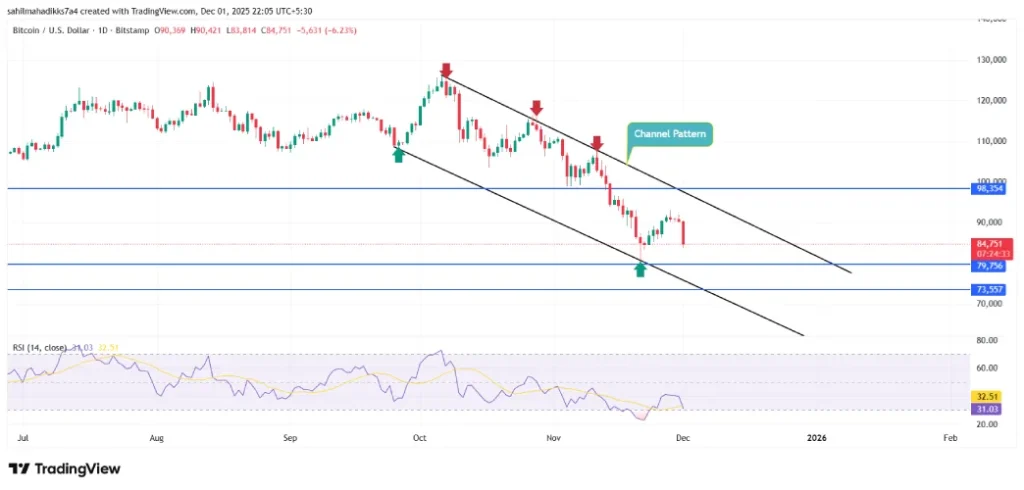
A recent bearish crossover between the 100-and-200-days exponential moving average slope suggests another key sell-signal for market participants. The 50-day slope also acts as an active dynamic resistance in price.
Also Read: SEC Chair Paul Atkins to Deliver a Major Speech Tomorrow
Credit: Source link