- SUI price prolongs its consolidation within a narrow range of bearish pennant pattern, preparing its next breakout in daily chart.
- Cooling oil prices helped ease inflation concerns, improving sentiment toward risk assets like cryptocurrencies.
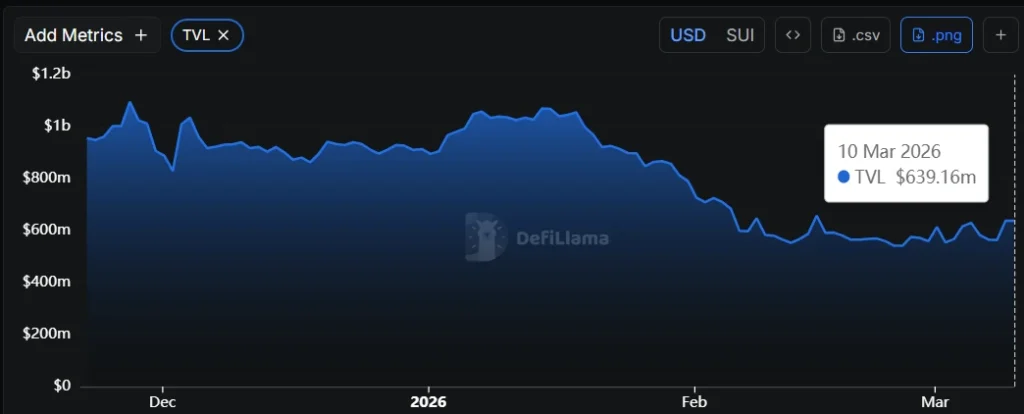
- SUI’s TVL remains sluggish around the $560 mark suggesting a lack of capital flow into the network DeFi service.
SUI, the native cryptocurrency of the SUI blockchain, jumped roughly 7% on Monday to currently exchange hands at $0.937. The buying pressure aligns with Bitcoin as macroeconomic tension eased in the broader market following oil’s sharp reversal from its all-time high. While the investor’s interest towards risky assets is gradually growing, the sluggish derivative trading and DeFI activity signals risk of prolonged correction.
SUI Attempts Breakout While Derivatives Interest Shrinks
On March 9th, the SUI price surged roughly 7% to reach its current trading value of $0.95. Simultaneously, the asset market cap reached $3.67 billion and the 24-hours trading volume is $628.8 million, accounting for a 78% surge since yesterday.
This rally coincides with a stabilization in the energy market; after an initial spike, falling oil prices have eased immediate inflationary fears, boosting sentiment for risk-on assets like cryptocurrency.
Sui’s token value is currently in a tight consolidation period, seemingly building strength for its potential breakout. However, activity tied to perpetual futures contracts has remained notably subdued, reflecting timid or reduced participation from leveraged traders.
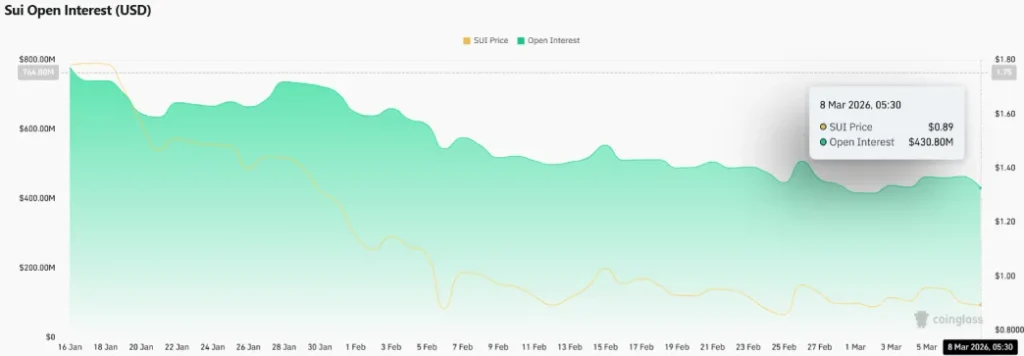
Recent numbers from Coinglass show that open interest for SUI futures contracts has dropped $955 million in early January to between $450-$465 million in early March 2026, registering a 51% reduction. This contraction is pointing to a meaningful retreat of speculative capital from the derivatives segment in the last two months.
On the network side, total value locked (TVL) across Sui’s DeFi protocols has remained sluggish around the $560-$645 million range for over a month now, with only minimum fluctuations noted in the latest data points across sources such as DefiLlama. This stability in locked capital implies the continued but controlled application and liquidity supply in the ecosystem within this timeframe.
Together, these metrics show a phase of low momentum and cautious positioning across leverage and core network economics, limiting the growth potential of SUI price.
SUI Price Test Range Breakout From Pennant Pattern
Over the past month, the SUI price has been consolidating within two converging trendlines of an inverted pennant pattern. The chart setup consists of a downsloping trendline indicating prevailing downtrend followed by a short-consolidation to rebuild its momentum for the next breakout.
With today’s market jump, the SUI price currently trades at $0.947 nearing a bullish breakout from ongoing sideways trend. A flip of the overhead resistance into potential support will bolster buyers to sufficient support to drive a recovery to $1.16, followed by $1.32.
However, the declining trendline of daily EMAs (20, 50, 100, and 200) suggest that broader trend remains bearish and paths to least resistance are down. If the supply pressure at $0.98 persists, the coin price could revert and breach the bottom trendline at $0.86.
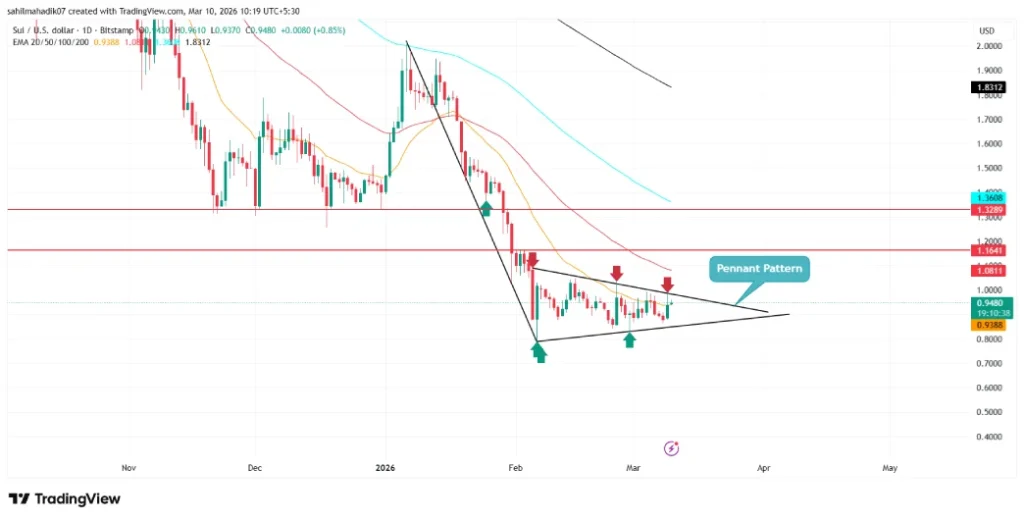
A bearish breakdown from triangle support could bolster a prolonged correction below $0.8.
Also Read: HYPE Rallies 13% as Hyperliquid Sees Massive Spike in Oil and Silver Trading
Credit: Source link